Trend line/lows for the week
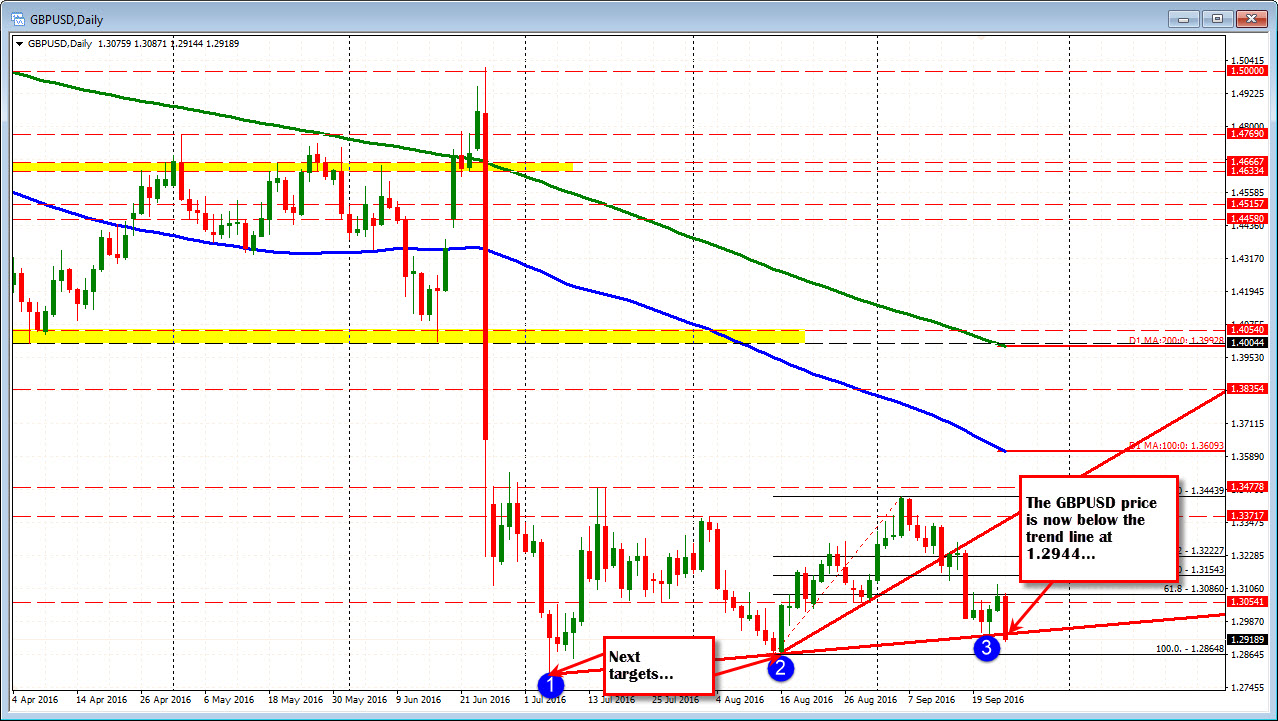
The GBPUSD is moving below the weeks lows and also below support against a trend line on the daily chart. The pairs decline has been helped by Brexit worries, a surge higher in the EURGBP and bearish technicals.
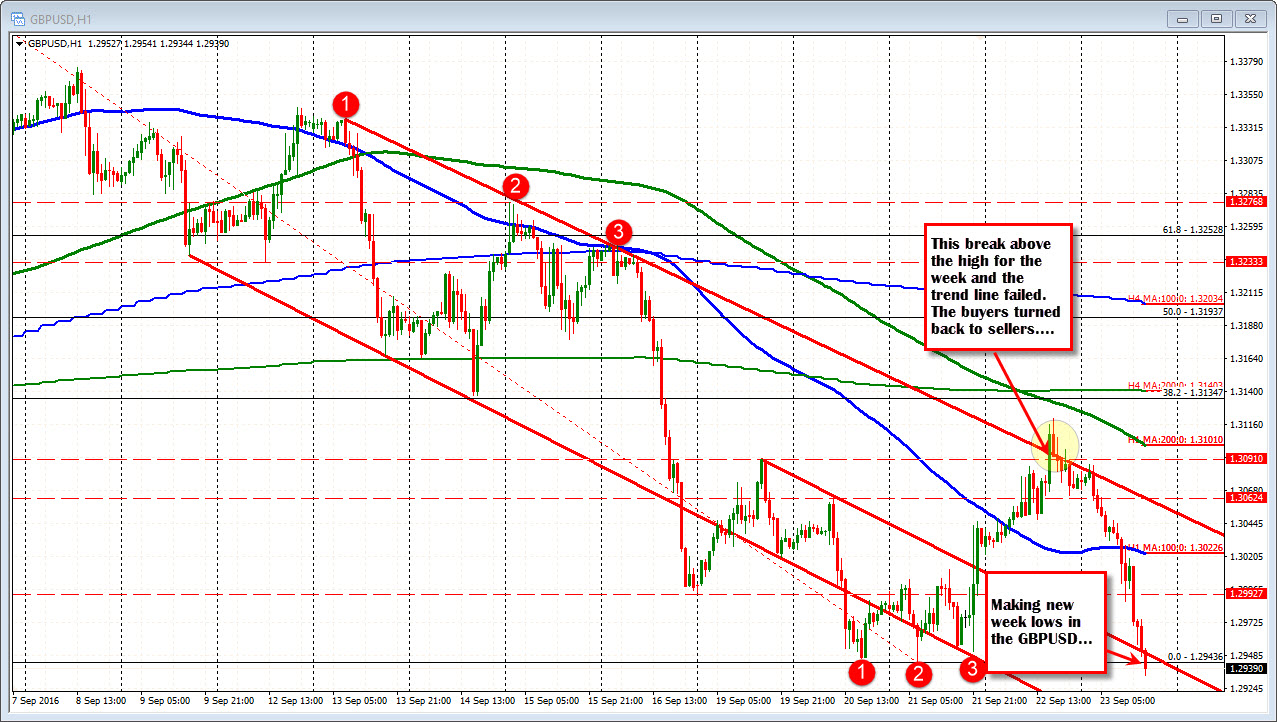
The GBPUSD tried had a modest corrective rally that started on Wednesday and continued on Thursday (see hourly chart above). When the price failed on the break above Monday's highs and above the topside trend line yesterday, the waters became muddy, and the price started back lower (see post warning yesterday). That move down has been accelerated today.
Looking at the daily chart, the pair has now moved below trend line support at the 1.2944 level. That trend line was tested earlier in the week. It is now close resistance. The next target for the pair off the daily chart comes in at the 1.28648 level (low from August).
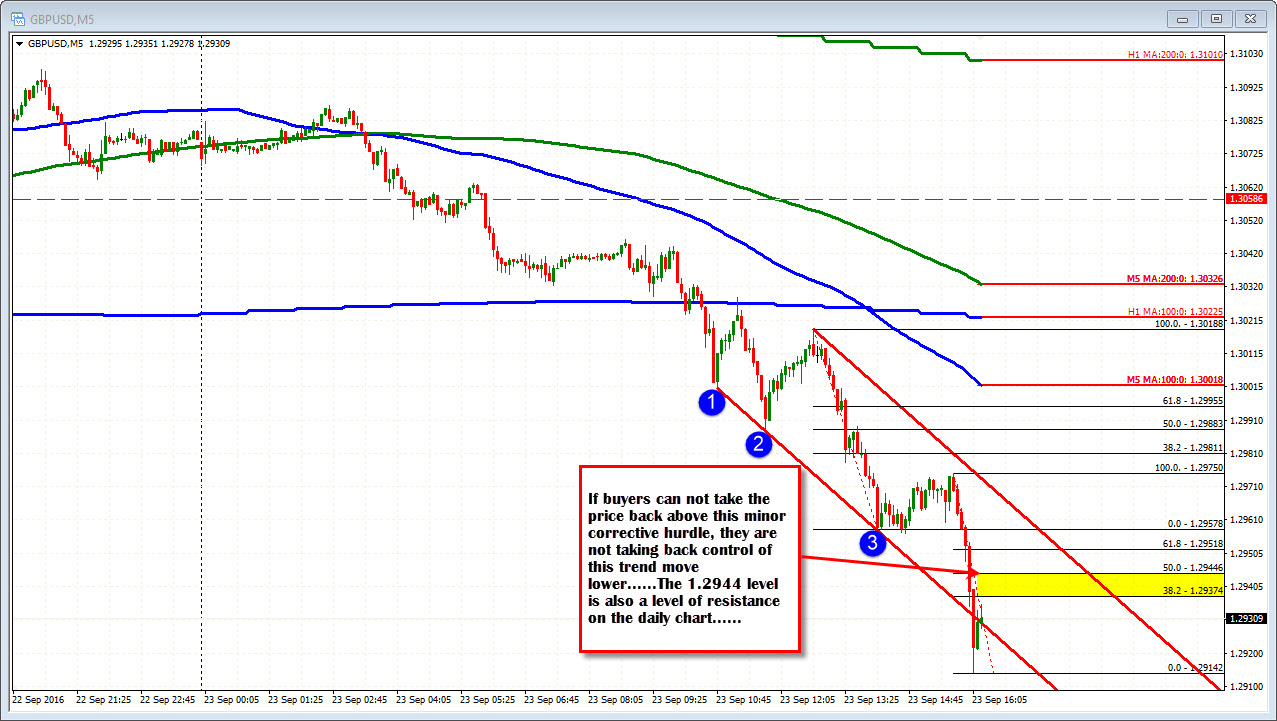
Looking at the 5-minute chart today (see chart below), the trend lower has seen modest corrections on the move lower (that is what trend moves do). The last leg lower (from 1.2975 to 1.2914) pushed the price below the lower trend line - an acceleration of the trend. The 38.2-50% of that leg comes in at 1.29374 to 1.29446. The 50% corresponds with the broken trend line on the daily chart.
I would expect seller near that level, if the sellers are to keep firm control. If the price moves above, it does not necessarily mean the move lower is over, but like at the highs yesterday, it muddies the technical water a bit.