Top holds. Bottom holds.
What do the GBPUSD charts say?
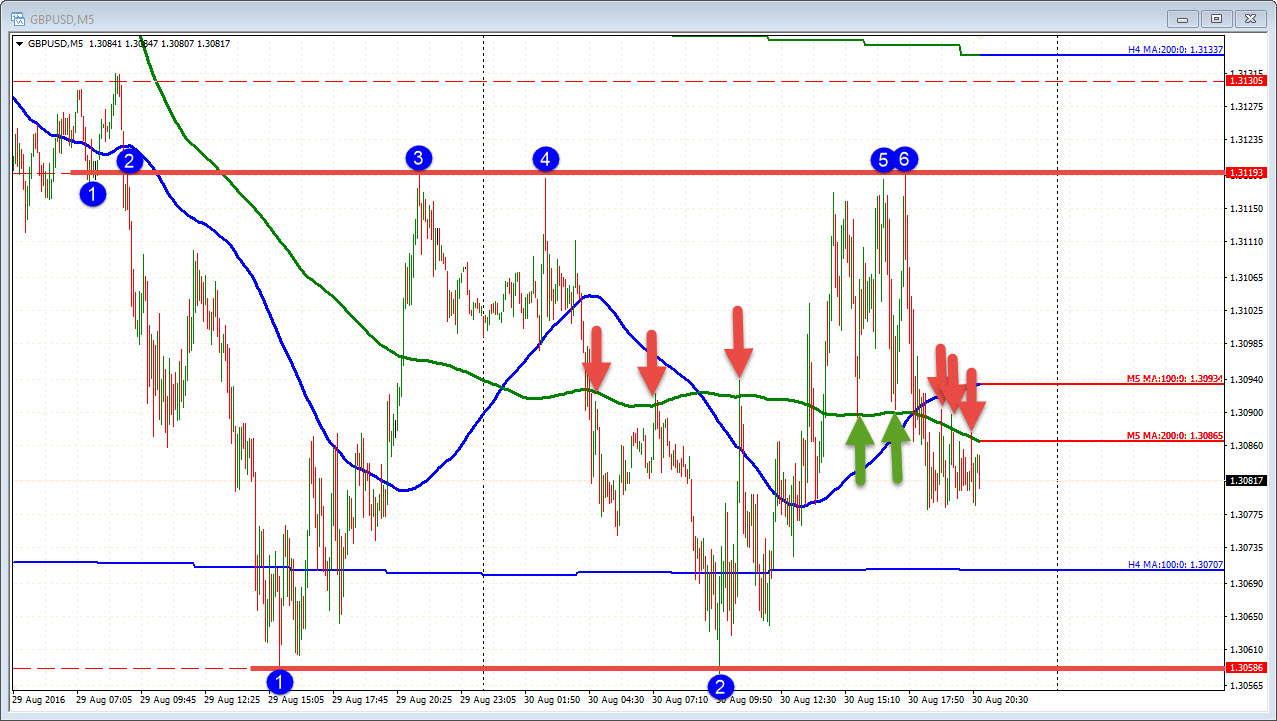
Looking at the intraday 5-minute chart, the price stalled at the yesterday's late high at the 1.3119. At the low, the low held against the low from yesterday's trading. Traders leaned at the both extremes. What else do we see from that chart? The 200 bar MA (green line) has seen the price move above and below the line. We are currently below both the 200 (green line) and the 100 (the blue line). Anything else? The price has not really reacted to the 100 bar MA on the 4-hour chart. That level comes in at 1.30707 currently in the chart above. Yesterday and today, the price could not sustain momentum.
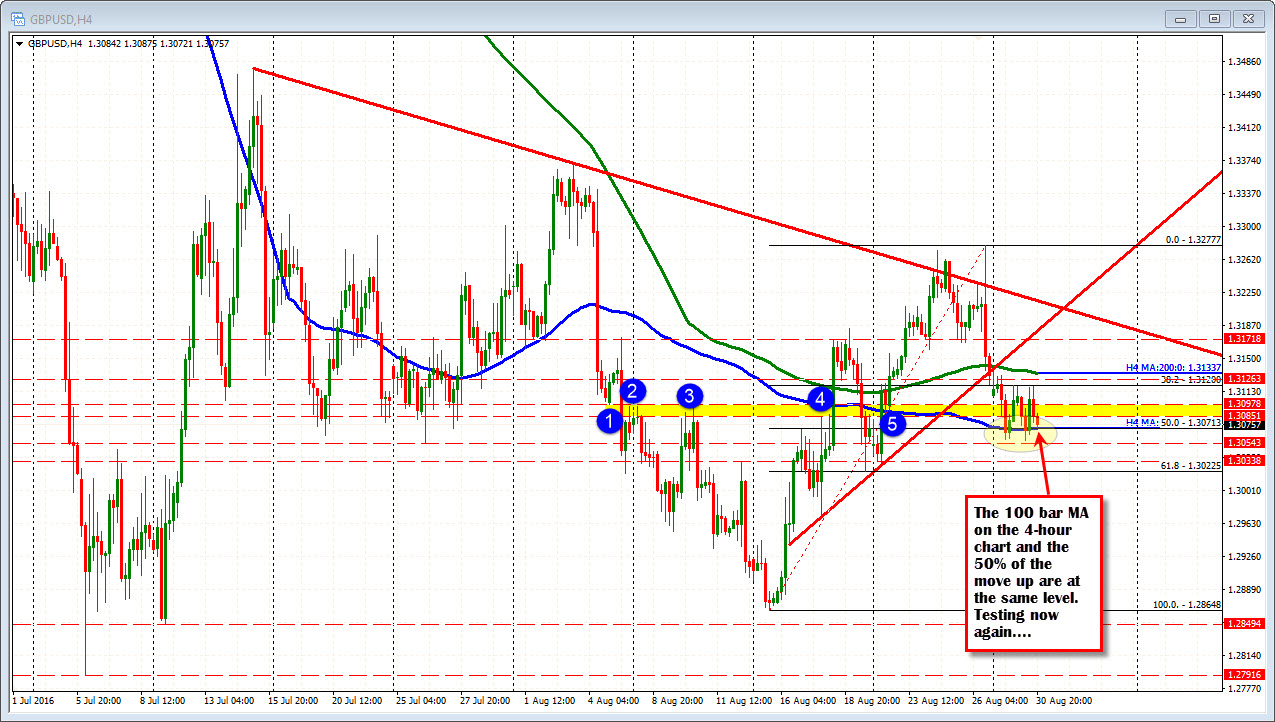
Drilling down to the 4-hour chart, what is it saying?
In addition to the inability to keep the selling below the 100 bar MA on the 4-hour chart (at 1.3071), that level also corresponded with the 50% retracement of the move up from August. So not only has the selling below the 100 bar mA on the 4-hour chart not solicited selling but falling below the recent 50% retracement has not done a thing.
We are currently a few pips away from that MA level/50% level. Will a break solicit more selling this time? Will we find support buyers? Will the price break and fail once again? Look for buyers to lean against the level, with stops below.