Lots of stuff from 1.2403 to 1.2418.
The GBPUSD traders have a phobia of trading below the 200 bar MA on the 4-hour chart. Since Feb 7th, the price has moved below that MA during 7 separate hourly bars and each time, the sellers covered. There have been no closes (0) below that MA line. The MA line must shock traders on each break even though it is higher (so each low is higher).
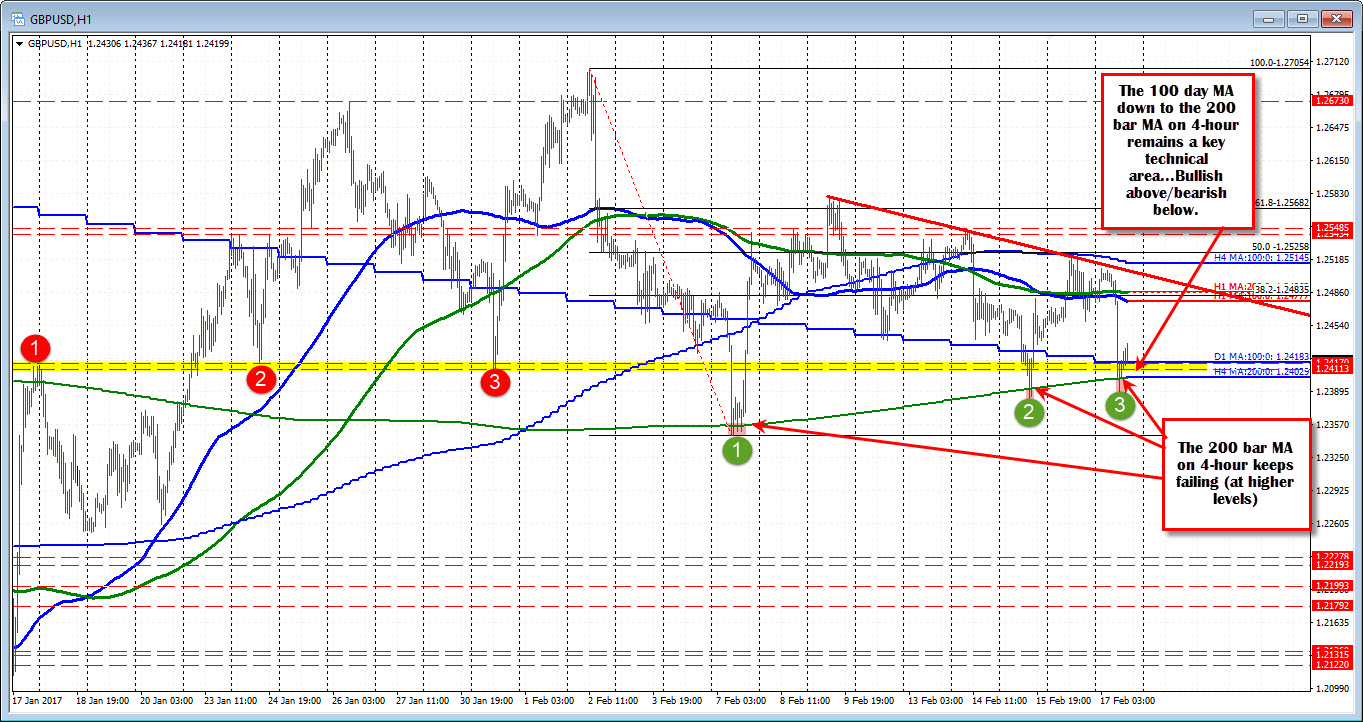
That 200 bar MA comes in at 1.2403 now.
Other technical levels that have my attention include swing levels in the 1.2411-17 area (see red circles), AND the 100 day MA at 1.24184 today.
So the 1.2403-18 is a cluster of levels that defines bullish above/bearish below. We currently area trading back above that level after the tumble lower.
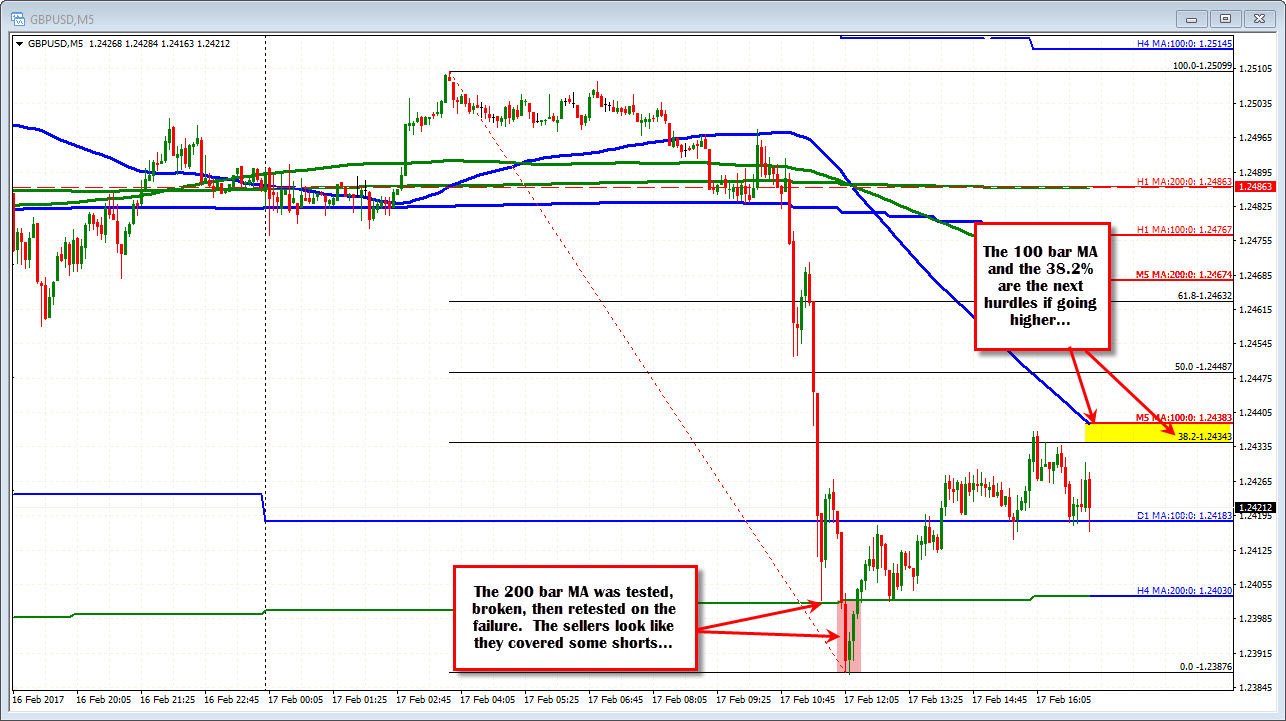
Now, the sellers certainly took the price lower and if you look at the 5 minute chart, the price correction off the low has only retraced to the 38.2% of the move lower. So although the price is above the aforementioned support, there is some reluctance to go too far higher. The 100 bar MA on the 5 minute chart is moving lower and the price remains below that MA. So shorts can still be comfortable. However, if the 38.2 is broken along with the 100 bar MA, that might change some of in intraday selling pressure into the weekend.