For the week, a break lower...More bearish.
The GBPUSD made a break for it this week and that break was to the downside.
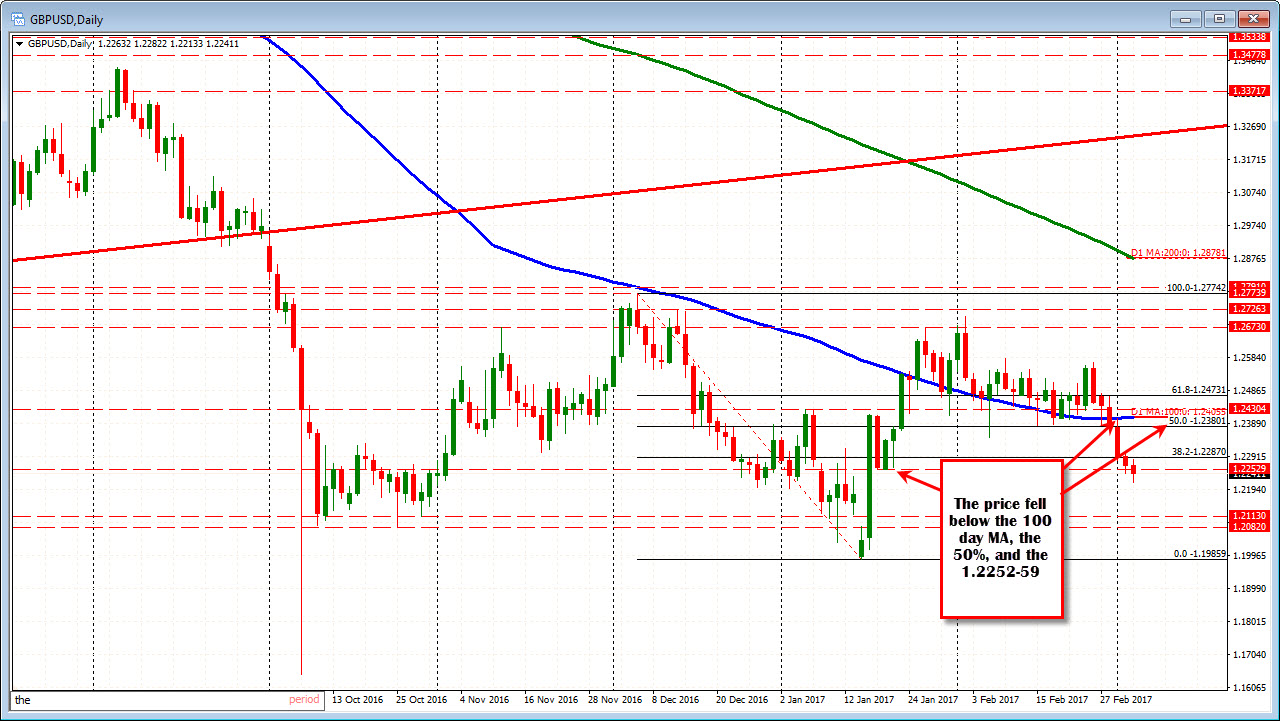
Looking at the daily chart,
- The price fell below the 100 day MA (and stayed below)
- The price move below the 50% of the range since the November election (at 1.2380)
- The price trades below the Jan 18, 19, and 20 low at 1.2252-59
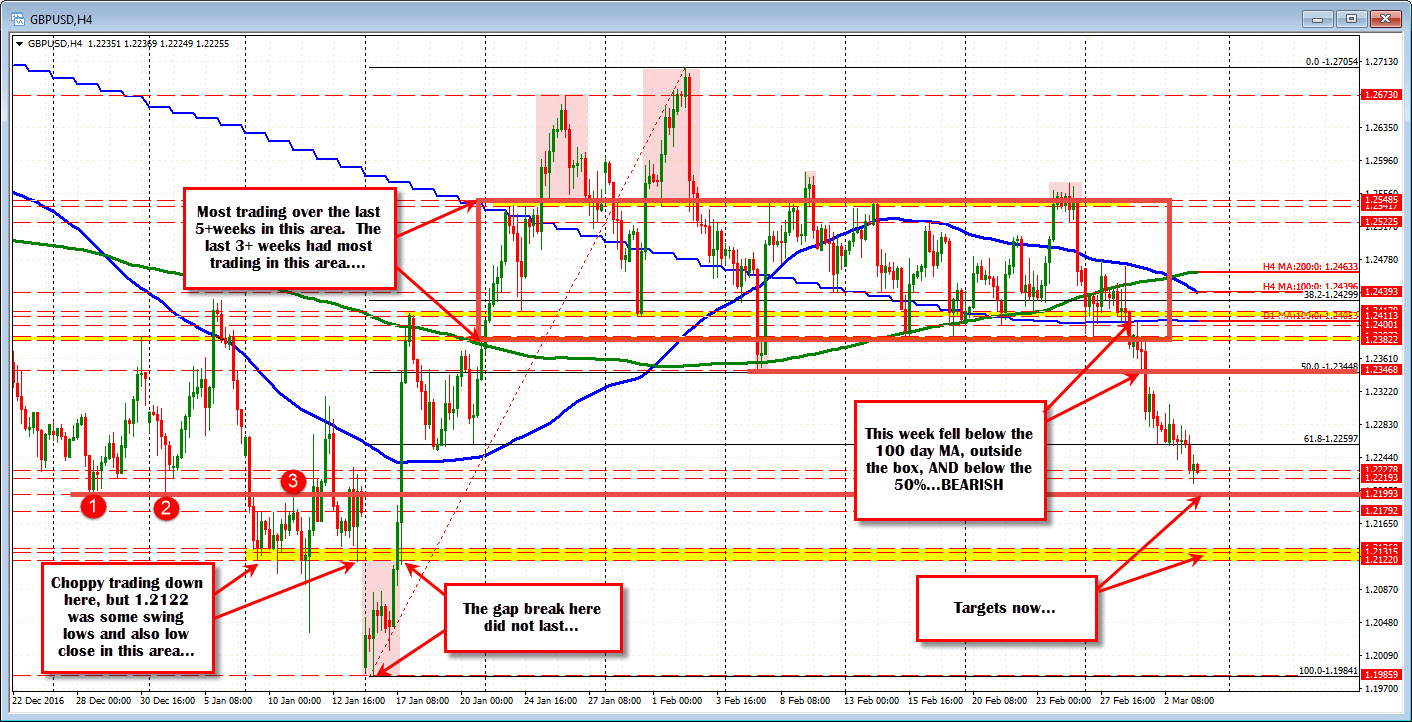
Looking at the 4-hour chart,
- The price moved outside the red box that has confined the pair over the last 3+ weeks (and most of the last 5-weeks). That box was from 1.2382 to 1.2548.
- The price moved below the 50% of the move up from the Jan 16 low at 1.23448.
- The price has moved below the 61.8% of the same move higher at 1.22597. That level is a close risk level for shorts now.
Staying on the 4-hour chart, the next target is around the 1.2200 level. That is a natural level to stall. It was a swing low on Dec 28 and Jan 3rd and a swing high on Jan 11. Yes we waffled above and below from Jan 12 to Jan 17, but when we moved back above on that day (Jan 17), the market ran. Below that the 1.2122 to 1.2138 is home to choppy lows from the Jan 10th week. The low close bar was 1.2122 too during that time.
What would ruin the picture and the bearish story?...
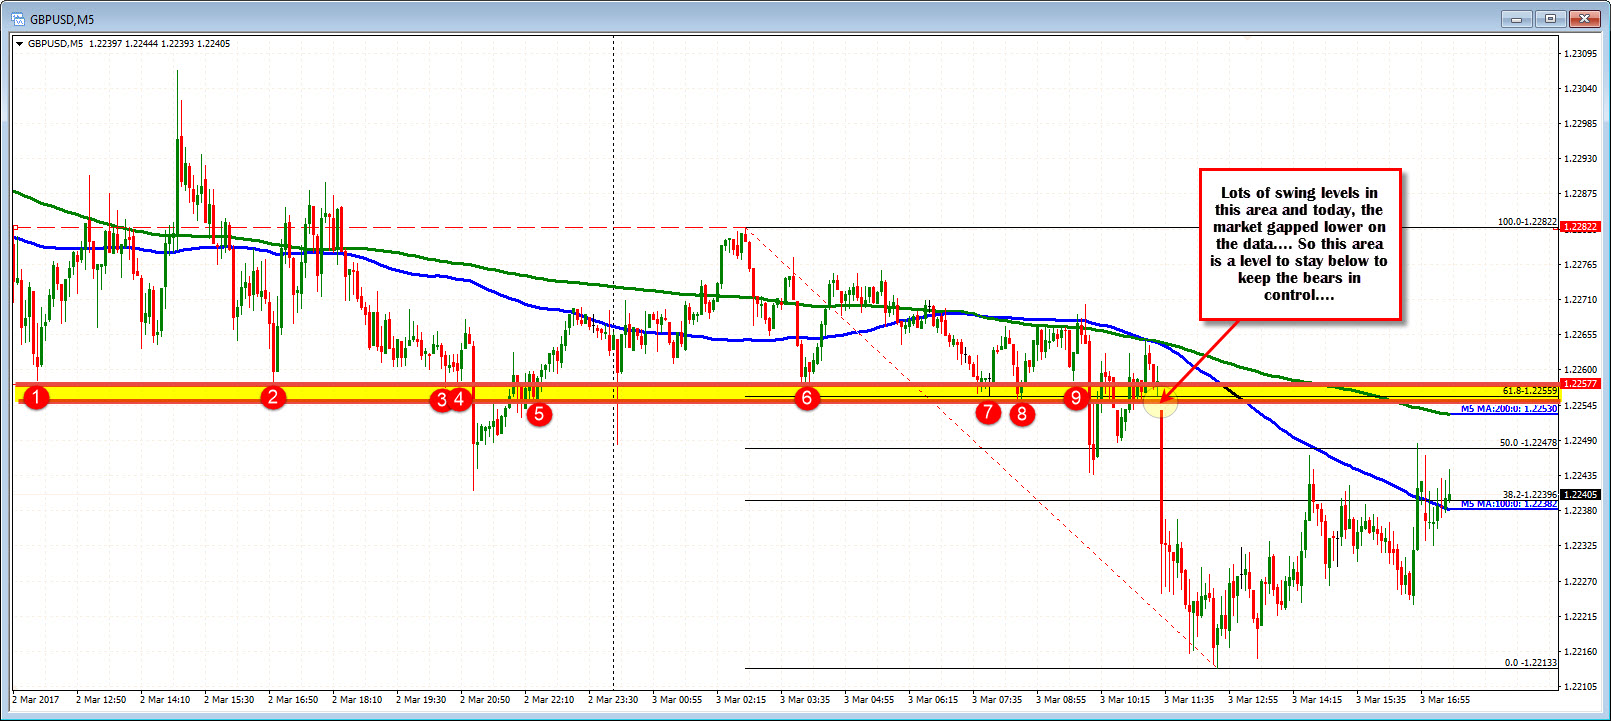
Getting back above the broken 61.8% at 1.22597 might signal some corrective action.
If you drill down to the intraday 5-minute chart, the 1.2255-587 confirms that retracement level. There was number of swing levels in that area (see yellow are in the chart below). Also, when the market moved lower today on the UK data, the price gapped in that area. Stay below is more bearish. Move above takes some of the steam out of the downside technically.