
A move below 115.96-116.11 (and stay below)
The USDJPY have moved to session lows but looking at the daily chart remains in a consolidation area. Last week the price moved to a low 115.05, and in the process, broke below an area I am eyeing as support - the 115.96- 116.09.
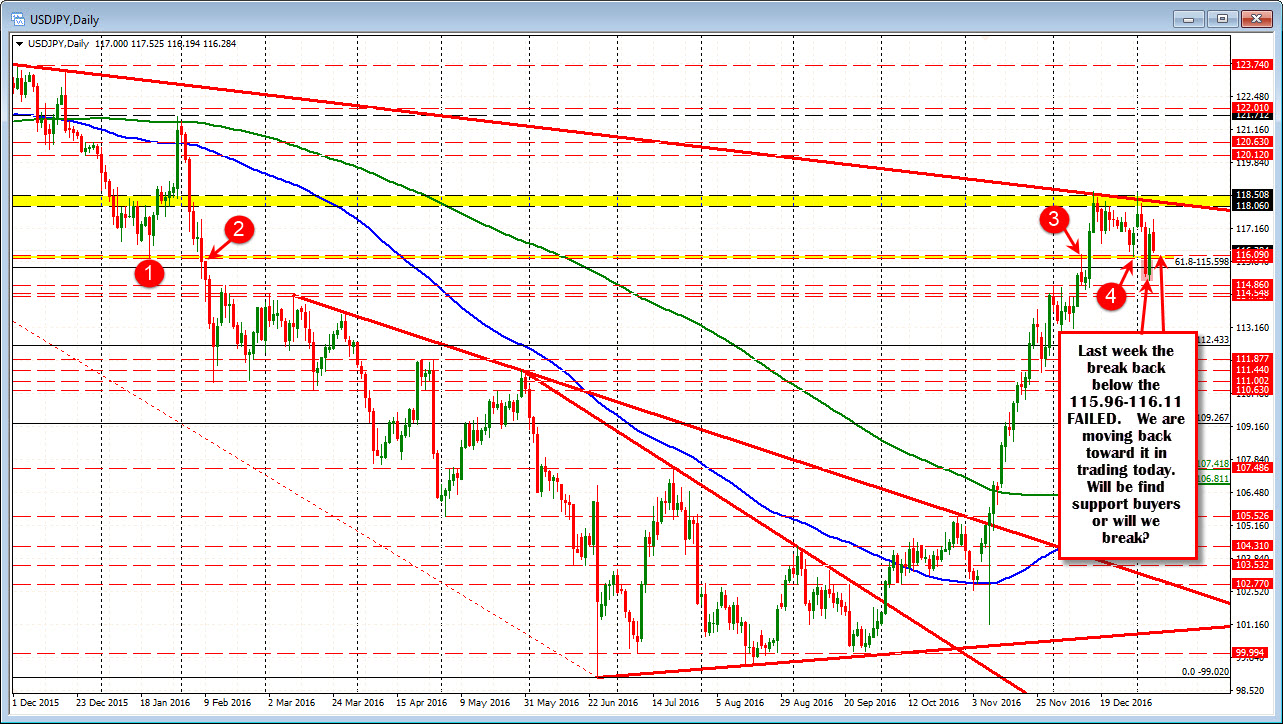
Going all the way back to Jan 2016, there was a swing low at 115.96 (red circle 1), then in February there was a break (red circle 2).. It was not until December 2016 when we revisited that area, first with a failed break to 116.11 on December 12th (Red circle 3). A few days later, the price pushed above that area. Most of the trading since that times is above the narrow yellow line. At the end of December, there was a swing low between those two extremes at 116.03 (red circle 4).
In the first few days of the New Year, the price fell below that area, but rebounded back above the next day. That break failed.
Today we are heading back toward that support area for another test. Will it hold? Will break? Will be break out of this consolidation area? The low today has reached 116.14 so far (as I type).
Drilling to the 5 minute chart, the sellers are remaining in control. We broke MA above including the 100 and 200 bar MA on the 5-minute, the 200 hour MA (at 116.999) and the 100 hour MA at 116.885 (see blue and green lines). The pair is in a trending channel, but have the support area ahead.
- If any correction can hold the channel, that is very good for the downward intraday trend.
- More conservatively, i any correction can hold the 38.-2-50% of the last trend move lower (from 117.18 to 116.14) that keeps sellers more in control (between 116.54-116.66). A move above the 116.66 and the bearish waters get more muddy.
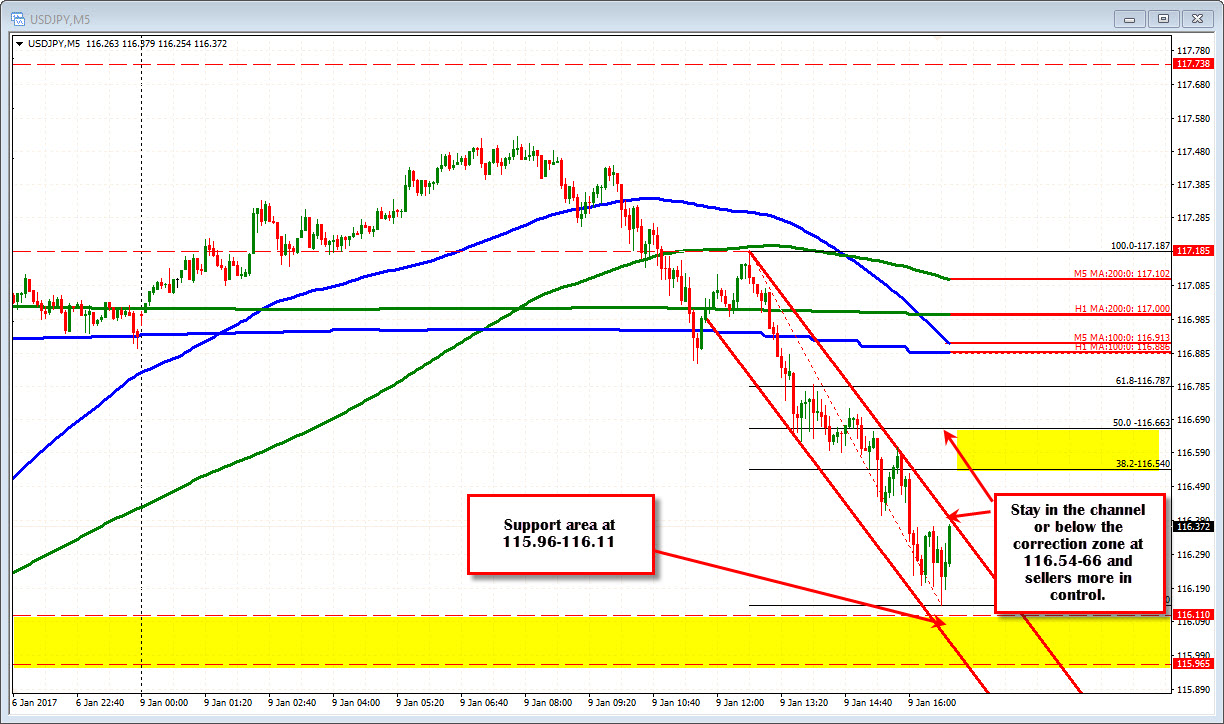
We are finding some support buying right now. Will that correction hold resistance and keep the lower trend going? That is what traders will be looking for in the correction now.

