Let the dust settle first. Understand what is weak/strong. Know the key targets. Be careful
Unemployment day. Risk is sky high. Not only is there market risk which is what we try to defuse each day, but also event and liquidity risk. Add to that the July 4th weekend. Greece referendum and a full moon (well I think there was a full moon yesterday) and we have some potential for one whale of a day.
We are not the whale but the barnacle on the back of a whale, so be careful people. For a preview of the details be sure to take a look at Adam's preview.
Trading wise, map out the plan on a bullish path and a bearish path. The bullish path for the EURUSD would be a weaker than expected number that would see the NFP 200 or below along with negative revisions. Also earnings need to be 0.2%-0.3% or weaker (no +0.5% or something like that).
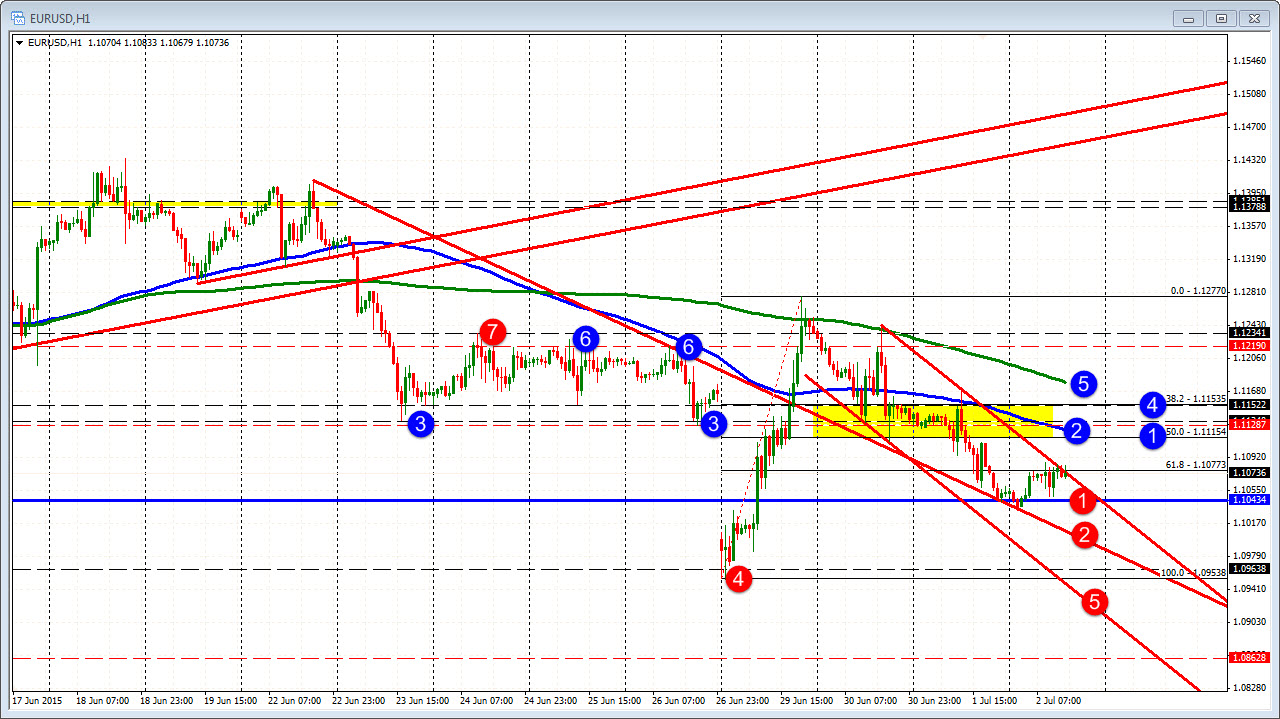
The following are the key targets on the topside given a weak number. The blue circles in the chart above correspond with the numbers in the list below:
- 1.1115 – this is the 50% retracement of the weeks trading range.
- *1.1123 – this is the 100 hour moving average (blue line in the chart above).
- 1.1128 to 1.1134- low levels from last week's trading (June 22 in June 26)
- 1.1153 - broken 38.2% retracement of the weeks trading range.
- *1.1178 – 200 hour moving average
- 1.1219 to 1.1234 – high prices from June 24, June 25 and June 26
I put an emphasis on the 100 and 200 hour MAs. If we can get and stay above the 100 hour MA, that should give the buyers more confident. IT will also make the testing and holding of the 100 day MA below more of a reason to go higher. A move to the 200 hour MA would make for a range for the day of about 150 pips. That is a little more than the average. So it is a doable target give a weaker number.
A stronger number would be >250K with positive revisions and 0.3% or more for wages will see the pair target the following downside targets:
- 1.1043 – 100 day moving average. The price fell below a key moving average on Monday's gap lower, but moved above and stayed above on that day. Yesterday the price tested the 100 day moving average and today there was a dip below in Asia-Pacific trading today. A stronger number should move and stay below the level for the rest of the day,
- 1.1007 - see slashing trend line on the hourly chart (red circle 2)
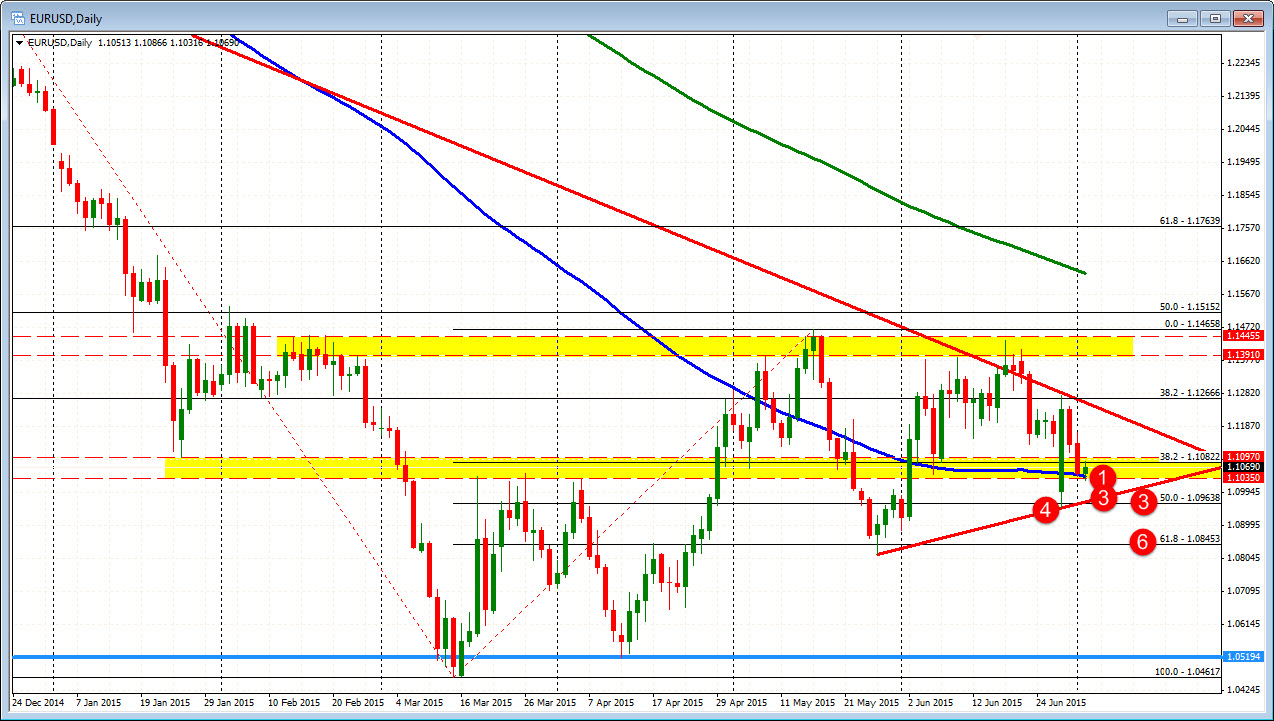
- 1.0963 to 1.0971. Trend line on the daily chart (see below) and the 50% retracement of the move up from the 2015 low to the may 2015 high (at 1.09638). See red circle 3 in chart below.
- 1.09538 – the low from Monday's trade. A move this level would imply a 133 pip range for the day which is around the average trading range over the last month. So this is a doable target GIVEN a strong number (Red circle 4)
- 1.0930ish - lower channel trend line on the hourly chart (Red circle 5 in hourly chart above)
- 1.0845 - a target for next week(Red circle 6 below). This is the 61.8% retracement of the move up from the March low It would be a 240-250 range for to get here. So it would need a STRONG number (i.e. Fed is tightening in September for sure).
Rules for trading, today's number is to understand that you need to let the dust settle. Know all the data, Determine if it is weak or strong. If it is neutral, have a good long weekend. Know the key targets. Be careful anyway. Greece, holiday, make for another risky weekend.