
Up and down activity. 2nd look below trend line support
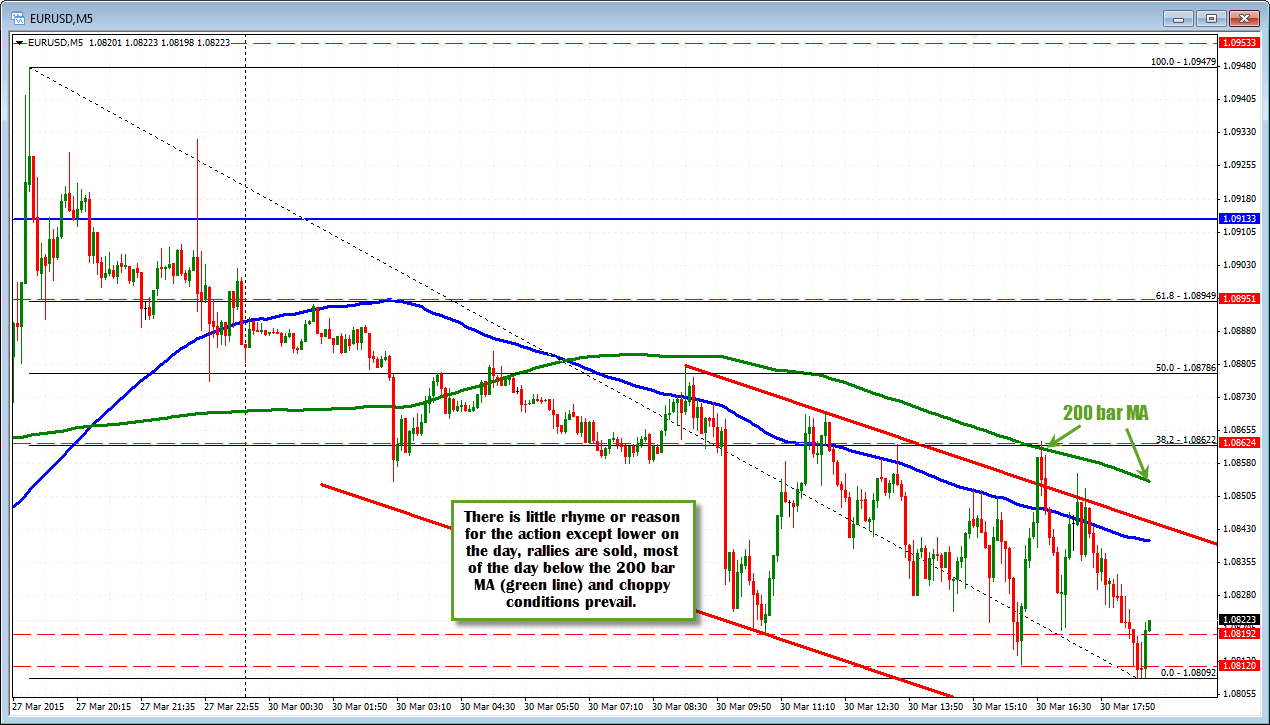
Admittedly, the price action in the EURUSD is not really a thing of beauty. The pair's price has been up and down in 50-60 pip moves. There are a number of red and green bar on the 5 minute chart (see chart below). It is simply not pretty.
What I know is this, however:
- The price is lower on the day
- Rallies are being sold with mostly lower highs.
- Although the 100 bar MA and the topside trend line did not hold as per my earlier comment (see earlier post), the 200 bar MA green line has been a cap for the NY session.
On the hourly chart, the price is trying for the 2nd time to push below trend line support. The first push, could not close below the moving average line and a rally higher ensued. In this move, the last hourly bar just closed below the trend line level. Can the sellers keep the lid on it? Also note on the hourly chart how the high for the last bar found sellers against the 50% retracement of the move up from the March 19 low. This is a risk level for shorts at the 1.0832 level now.
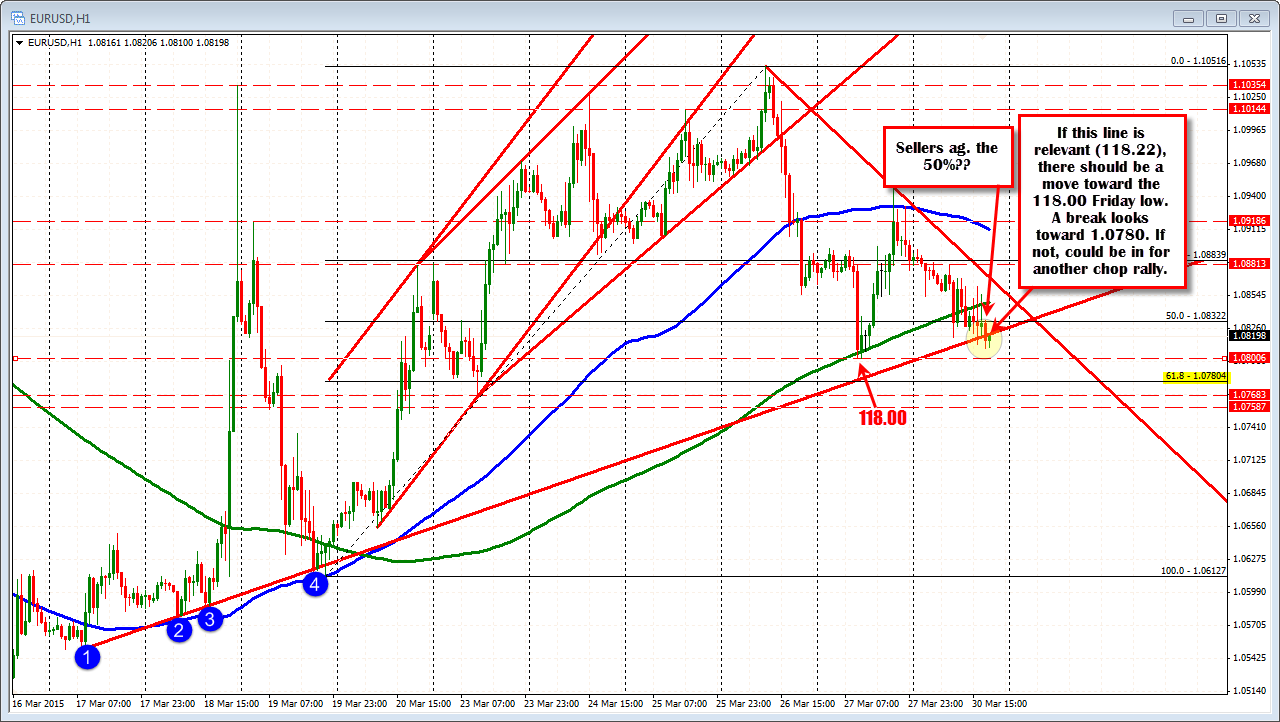
I may be grasping at straws to see if a bias sticks in what is a choppy trading day, that is also a day before quarter end and Japanese year end. So be aware. However, if there is a bias, it is down. It just needs that extra push and some support from the sellers via a little more directional momentum. .

