
100 hour MA and 100 bar MA on 4 hour chart define the range
The EURUSD has an interesting technical battle being waged between the 100 hour moving average below, and the 100 bar moving average on the 4-hour chart.
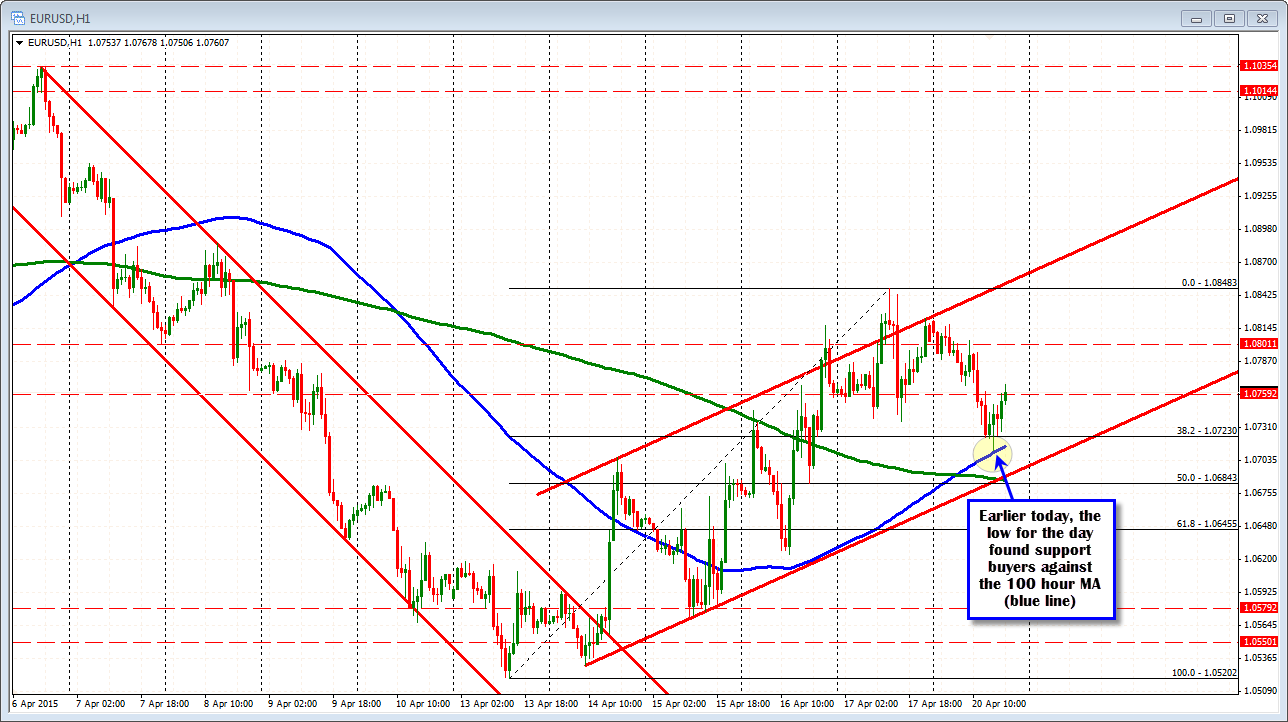
The 100 hour MA provided support at the lows today at the 1.0710 level (see earlier post). The MA is now at the 1.07156 level (and rising).
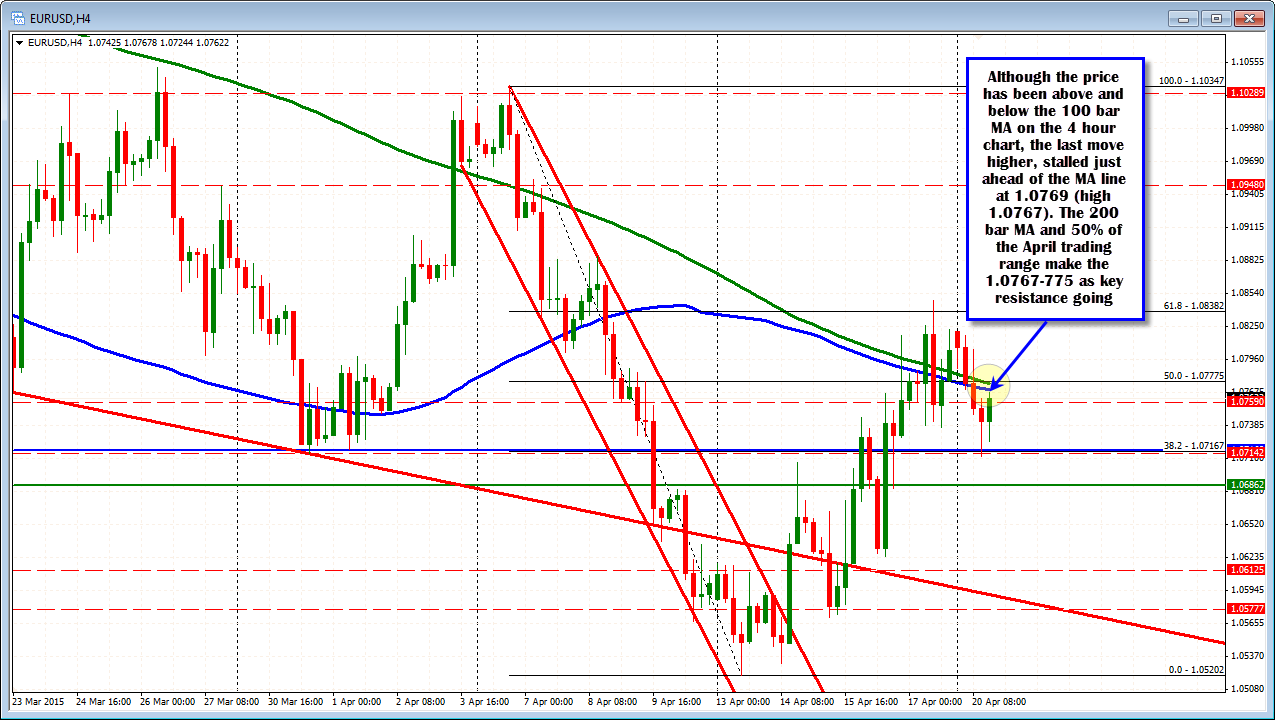
On the topside in in the NY session the 100 bar MA on the 4-hour chart comes in at the 1.0769 (see chart below). The high for the New York session comes in at 1.0767 so far. The 200 bar MA on the 4 hour chart is not that far away at 1.07756 and the 50% of the move down from the April high is at 1.07775.
With the 100 hour MA holding support below, and the 100 bar MA on the 4 hour chart holding resistance, the combination gives traders the bookends to lean against/to rely on to define and limit risk. Currently, with each holding that is what traders are choosing to do as the week gets off to a start. Going forward, the price will eventually decide to break higher or break lower.
Do you see it going higher? or lower?
As a result,
- Use the 1.0769-775 (inclusive of the 200 bar MA and the 50%) as the topside line in the sand, and the
- 100 hour MA on the downside as the bottom side line in the sand (at 1.07156 currently - and rising)
When there is a battle being fought, and trader can easily see the battle lines that are drawn, it provides a good thing for traders.
Risk can be defined and limited against the levels, and a look toward a break away can be anticipated for confirmation of the battles winner.

