
No change in rates
The ECB has kept rates on hold as per expectations. What now for Draghi?
Eamonn has a list of questions for Draghi. Ryan added his two cents on what he would do HERE.
Needless to say the focus will be on the imminent QE. It seemed like ages ago when it was announced that QE of 60B euros per month would be started in March. Well it is March and the world wants to know more details.
In advance the EURUSD has wandered lower. German factory orders for January were a disappointment - nearly racing the entire 4.4% increase in December (-3.9% vs -1.0% estimate). Germany's Markit construction PMI rose to 53.1 from 49.5, but the retail PMI fell to 51.5 from 52.3.
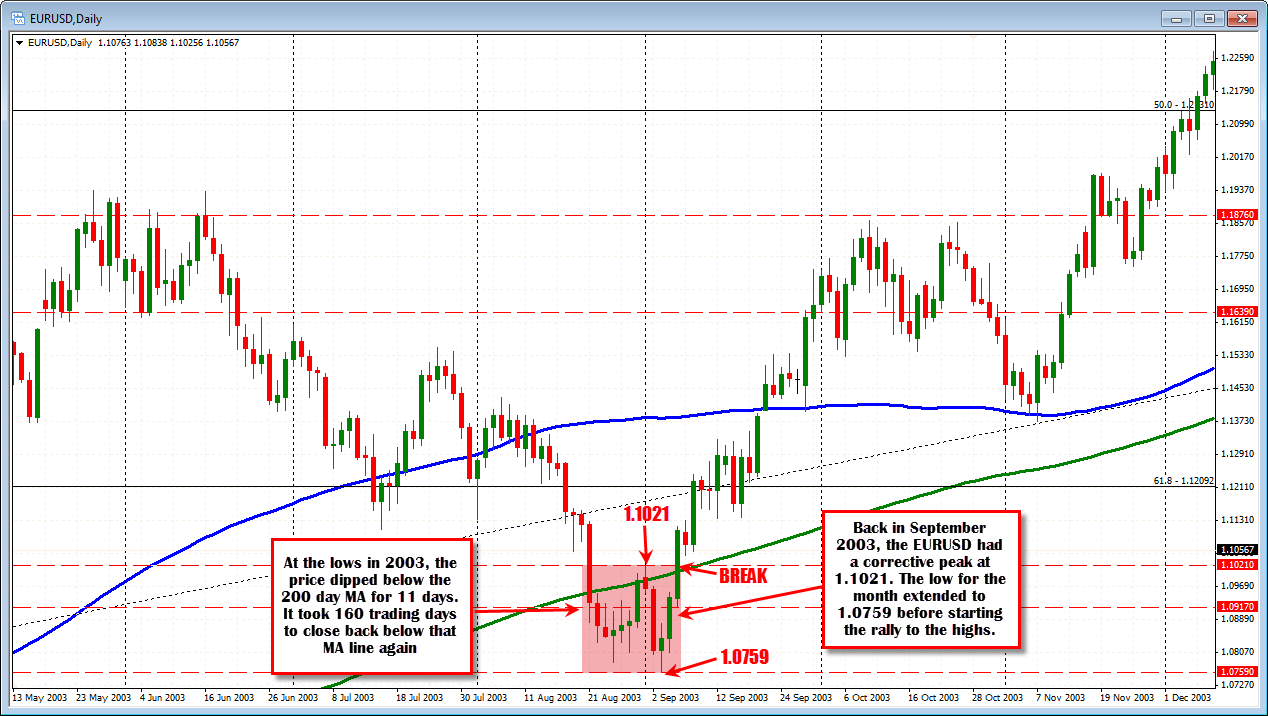
Technically, the price of the EURUSD moved to another 11 year low today. The last time the price was at these levels was back in September 2003 (see daily chart from 2003 above). The high price on first trading day of that month (September 1, 2003) peaked at 1.1021. The low price today is 1.1025. Coincidence? I don't think so. The "market" will find something to lean against to put a line in the sand. That price is the line in the sand on the downside to get below today. The price is moving back higher as NY traders enter (currently trading a 1.1070 in some pre-press conference short covering).
A move below that level today (and staying below that level) should keep the pressure on the EURUSD.
The low price in 2003 (see chart above), extended to 1.0759. This is the next major target on the downside for the pair. During that period of time, the price traded below the 200 day moving average for 11 trading days (see red area in the chart above). On September 5 the price traded back above the 200 day moving average. It took 160 trading days later to move back below the 200 day moving average.
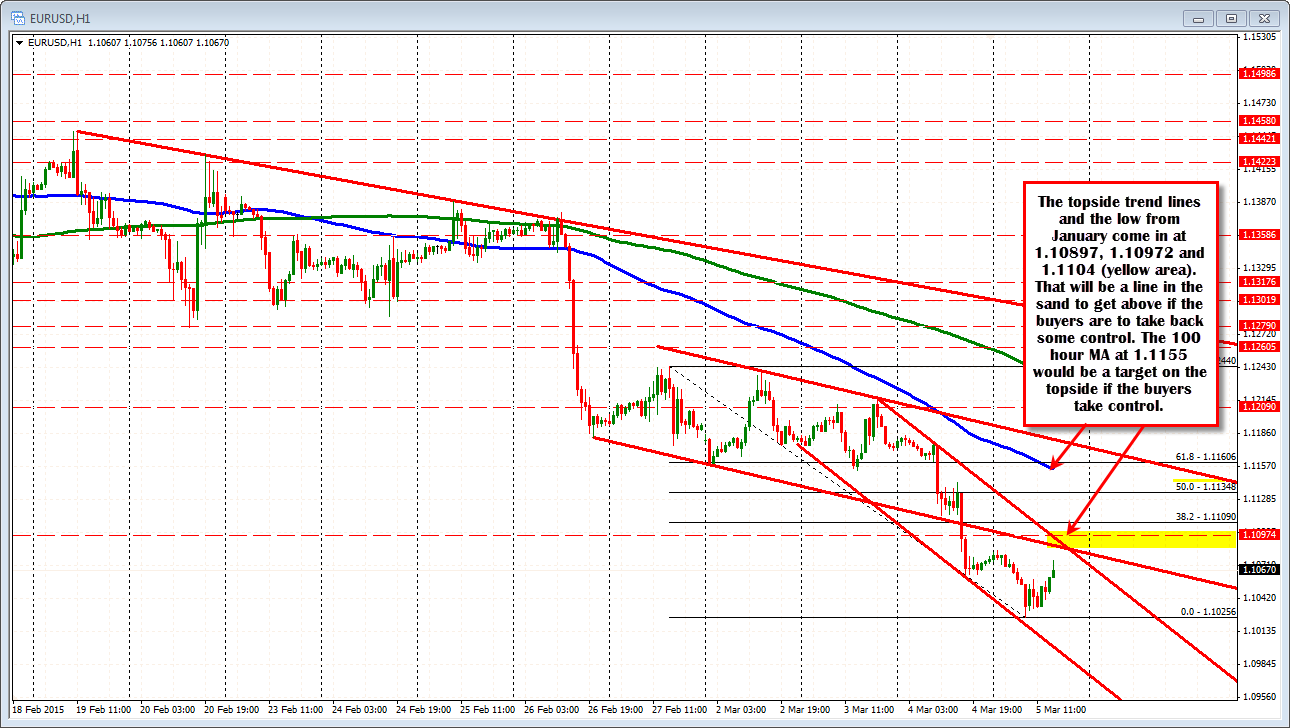
Looking at the hourly chart the price yesterday fell below trend line support. The underside of that line comes in at 1.10897. A higher topside trend line comes in at 1.1104. The January 2015 low came in at 1.10972. The two trend line levels bookend the low price level from January. This area will be a close line in the sand on the topside today. Move above and traders and the level becomes support (for the day at least). Stay below and the sellers remain in control.
On a move above, traders will eye the 38.2% and 50% retracement targets at the 1.1109 and 1.1134 respectively. The 100 hour MA ( blue line in the chart above) currently comes in at 1.1155 and would be another topside objective. A move up that level would imply a trading range for the day of about 128 pips. That would be a doable target given less dovish comments. The question is "Can he be less dovish?" He may see a somewhat better economy but it is off a low level and the ECB is still behind the curve.

