For now?
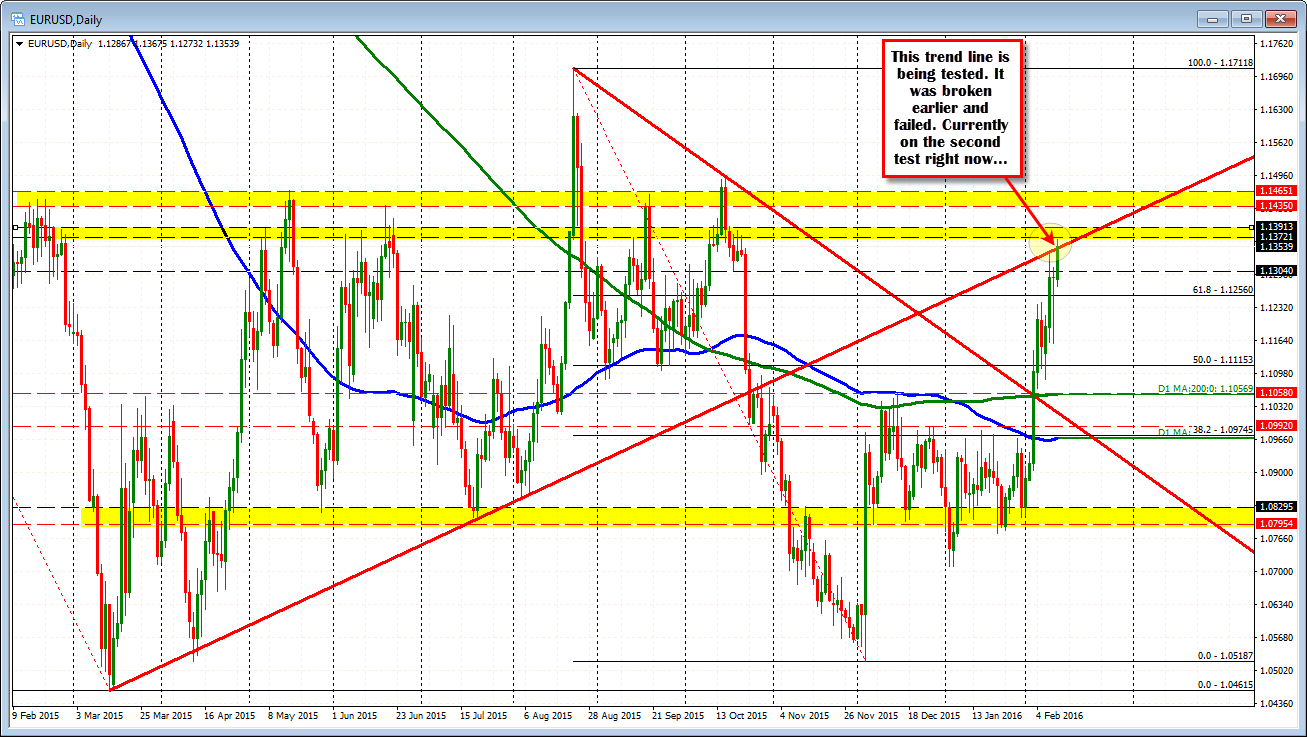
The EURUSD reaction is that stocks go down, the EURUSD benefits. EURGBP also goes higher. Yesterday, the pair did dip and fall below the 100 hour MA and trend line on the hourly chart. That lasted for less than an hour. The price today extended to the highest level since October 21. In the process the pair moved above the underside of an old trend line (see daily chart below). That trend line was tested and held on Tuesday. Today it was broken and failed....well maybe. The line cuts across at 1.1354 currently and the price is testing right as the stocks open. I guess the traders are not all that bullish on a stock reversal.
What does drilling down into a shorter term chart say?
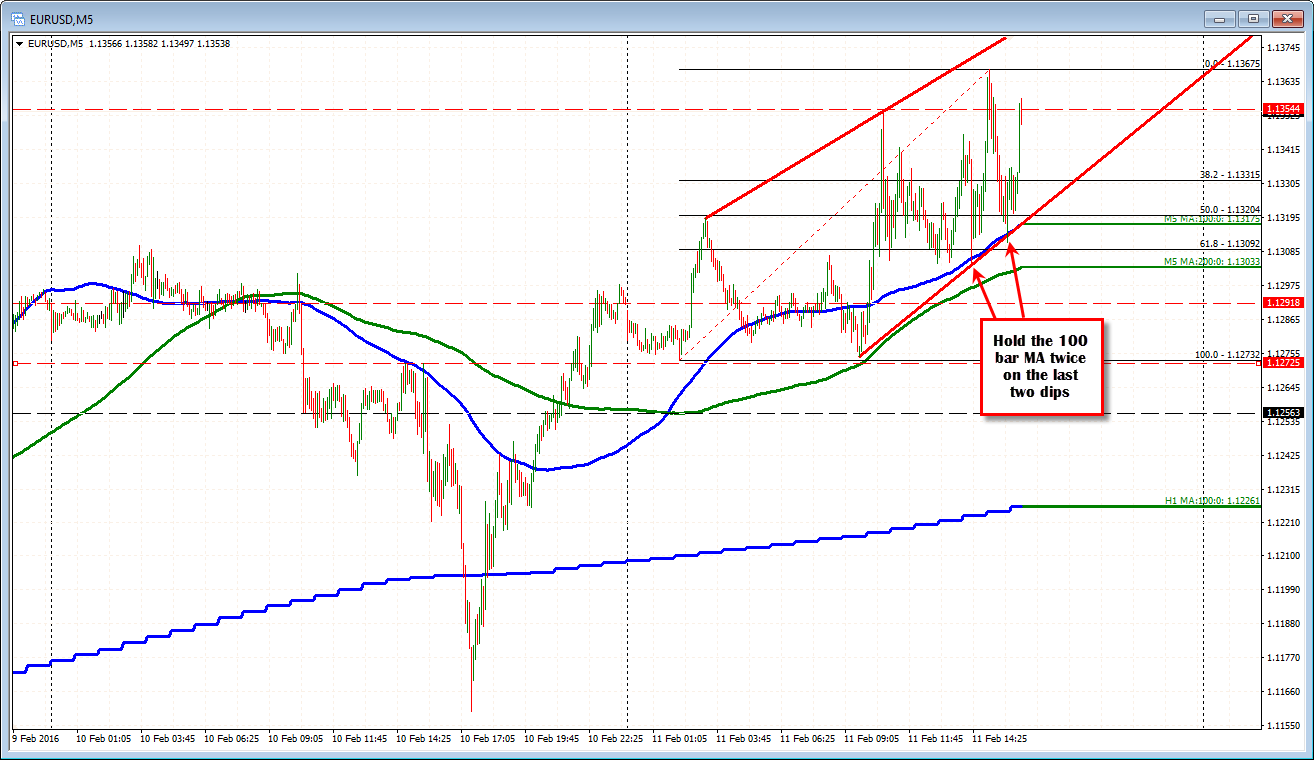
The 5 minute chart is showing up and down, choppy action. Note the lows... The 100 bar MA is finding buyers on the last two dips.
So there may be a failure above on the daily (well maybe), there is no confirmation on the drill down in the 5 minute chart. If that trend line and 100 bar MA on the 5-minute chart can be broken, maybe there is some other technical reason to sell. but at the moment we are not seeing it yet.