Moves through key levels
While the EURUSD was triggering stops and stops and stops, the EURJPY was doing the same.
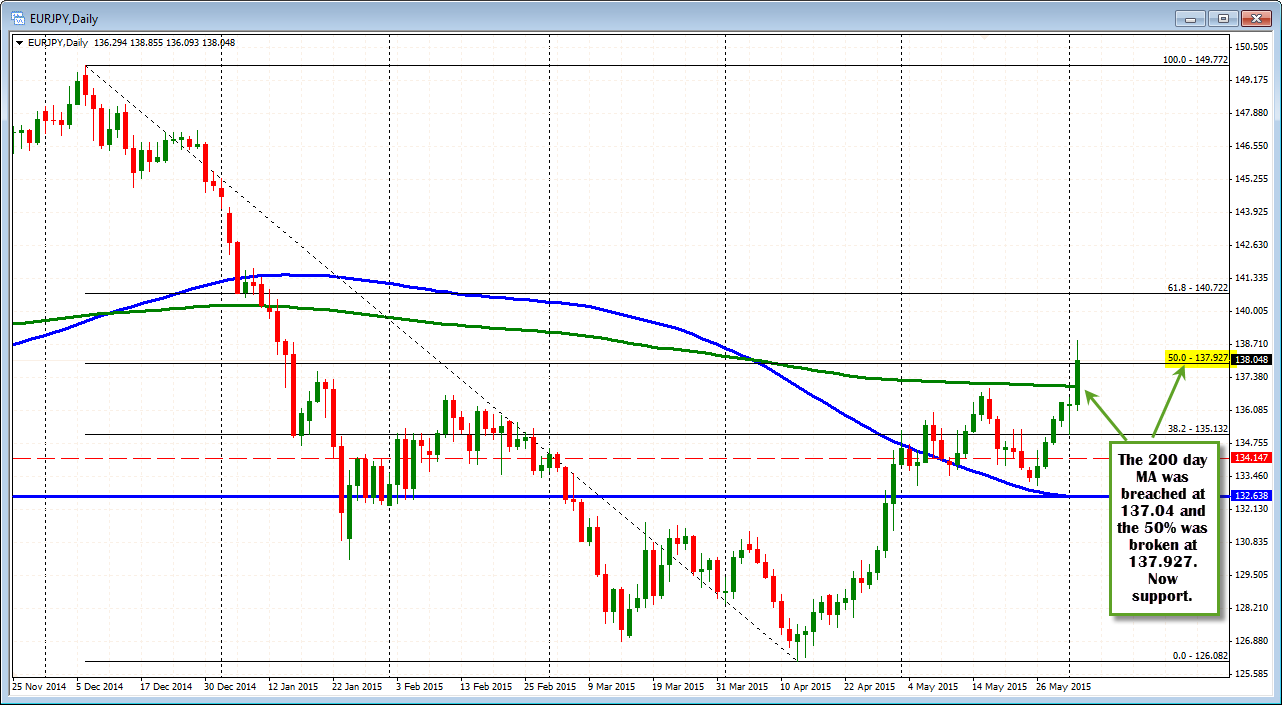
- Looking at the daily chart, the price moved above the 200 day MA at the 137.04 level. (green line in the chart above)
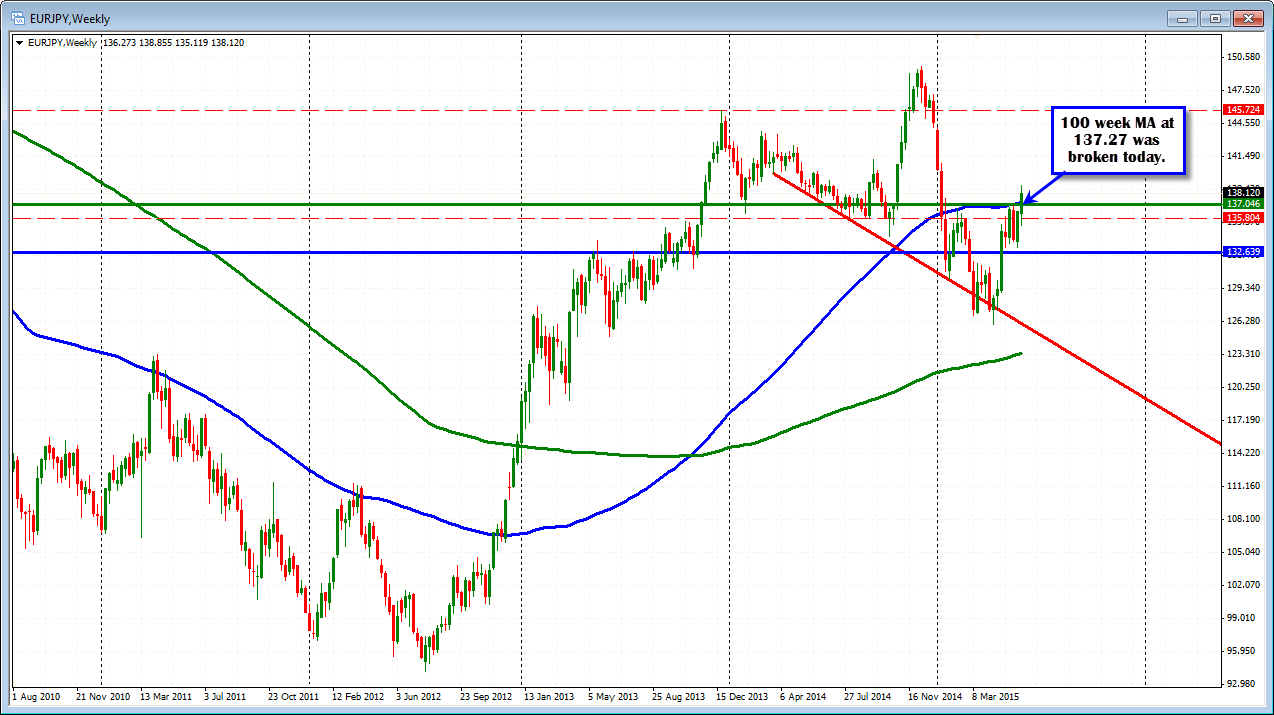
- The 100 week moving average was not far behind at 137.235 (blue line in the chart below).
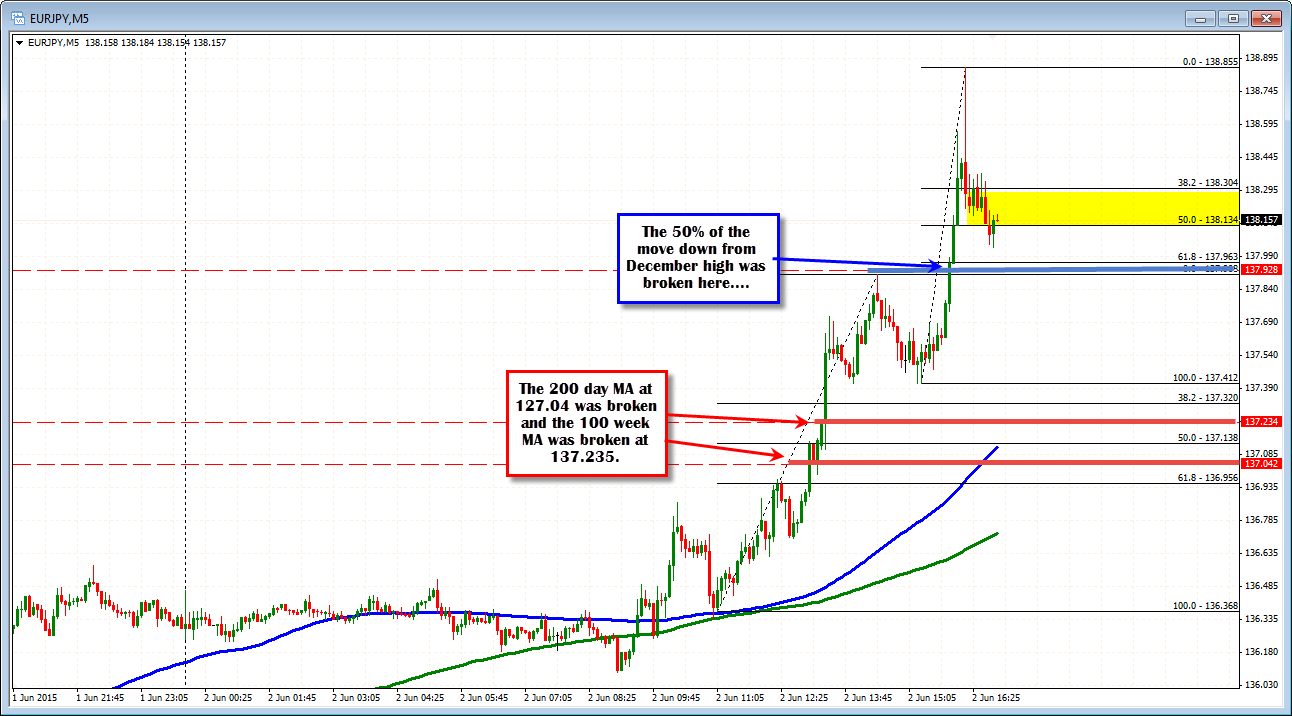
- The 50% of the move down from the December high was the next breach at the 137.927 level
Stocks in the USD are opening lower which has slowed the rise (or so it seems) in the pair. The price of the EURJPY has dipped lower and has move below the 50% of the last leg higher in the pair at 138.13 (see 5 minute chart below). Not far away is the 137.927 level which is the 50% of the move down from December high. This was a swing high on the earlier trend leg higher. It will be eyed as support for both reasons now. The wild card is the stock market. When the stocks get hit, it can start to be reflected in the JPY and the JPY crosses.