
Hurt by weaker employment data, then dollar strength
The AUDUSD has been hit today but a weaker than expected employment in Australia AND more USD buying in trading in the US today.
The employment report showed that eemployment fell by 9.8 K last month. The eestimate was for a 15K increase. The change is not likely to lead to a cut in rates at the next RBA meeting but it did slow the AUDUSD recent move higher. The AUDUSD has been up for 6 straight days. That string took the price from a low of 0.7506 to a high (reached today before the employment report) at 0.7734.
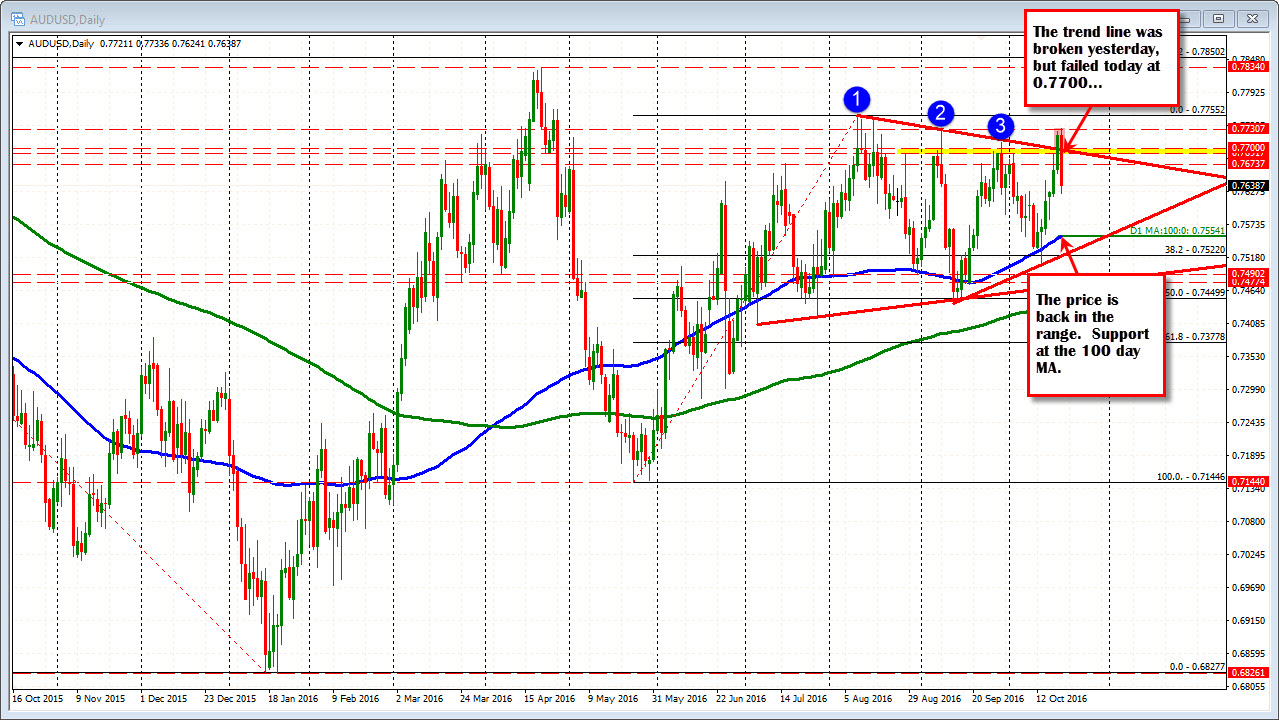
Technically, looking at the daily chart, the pair squeezed above the key 0.77000 level yesterday. That level was the highest closing level going back to the end of April. It also was where a trend line cut across (see daily chart above).
When you go into a key economic release(like the employment report) at an extreme and that report disappoints, there is a greater risk, those traders who forced the move to the extreme (in this case the high) exit the ship. In the AUDUSD, the longs/buyers exited the ship after the price moved back below the break level at the 0.7700 level. You can see this on the hourly chart below.
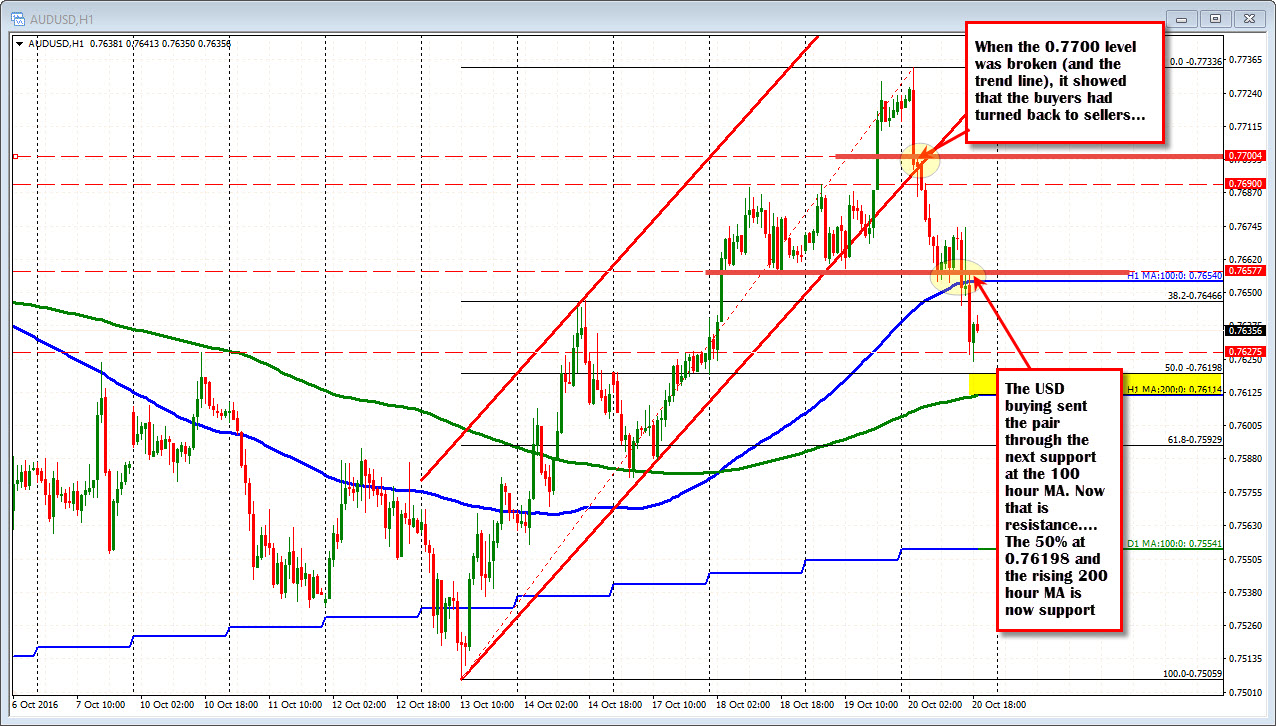
Staying on the hourly chart, the fall extended down to the 100 hour MA (blue line in the hourly chart above) in the London morning session, then broke below that MA line with the US dollar buying. That break tested the next target against the 50% retracement at the 0.76198 level. The low has reached 0.7624. The price is bouncing modestly off that support target area.
What next?
The 100 hour MA above now becomes a close target/risk level for shorts (and the bearish bias). Stay below and the bears remain in control.
On the downside, the 50% and then the 200 hour MA (green line in the chart at 0.7611 and moving higher), are key support levels. With the range today (from high to low) at 110 pips and the 22 day average at 69 pips. there is reasons to expect that the intraday support levels should be difficult to break - at least today.
Does it mean the low is in place?
No, not necessarily. Did the technical picture deteriorate from the bullish break above the 0.7700 level yesterday. Absolutely it did. That is looking more like a big failure now. As a result we could be heading back down to the 100 day MA over time at the 0.7554 level (blue line on the daily chart).
The market could also shrug off the number as a one off . In which case a move back above the 100 hour MA (at 0.7654) will be eyed as a clue that the buyers are back in.
The battle is on with a key level below and key level above defining the bearish and bullish boundaries. The traders will decide and it will be reflected in the price action and tools applied to that price action.

