Corrects lower in trading today
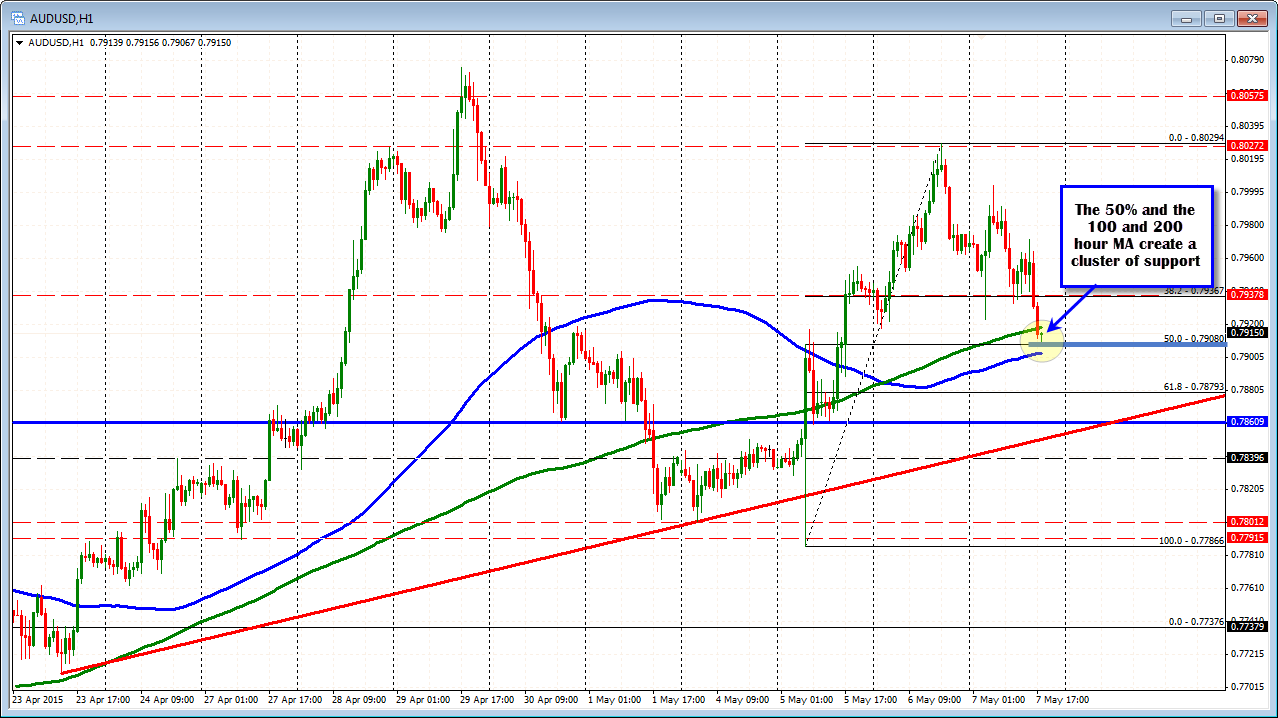
The 100 and 200 hour MAs (blue and green lines at 0.7902 and 0.7918 respectively) bookend the 50% of the move up from the May 5 low at 0.7908. Is it enough to slow, the decline?
The pair had the RBA cut this week but they took out a easing bias from the statement - bullish, That led to a volatile move lower followed by a snap back move higher on Tuesday.
The momentum higher continued yesterday until the pair hit a wall at the 0.8030 level (see post from yesterday outlining that levels importance - bearish technicallly).
The Employment report last night was weaker than expected but the pair sold off then rallied again - bearish fundamentally, but bullish technically at least on the first move).
The 0.8000 area stalled the rally an it has been down since (more bearish/less bullish?).
What now?
Well, clearly the area above and below the 0.7908 level has a cluster of support on the hourly chart. From that perspective we can expect - and are seeing - a slowing (at least for now) at the area. A move below the 100 hour MA would change that bias and push it more to the bearish side.
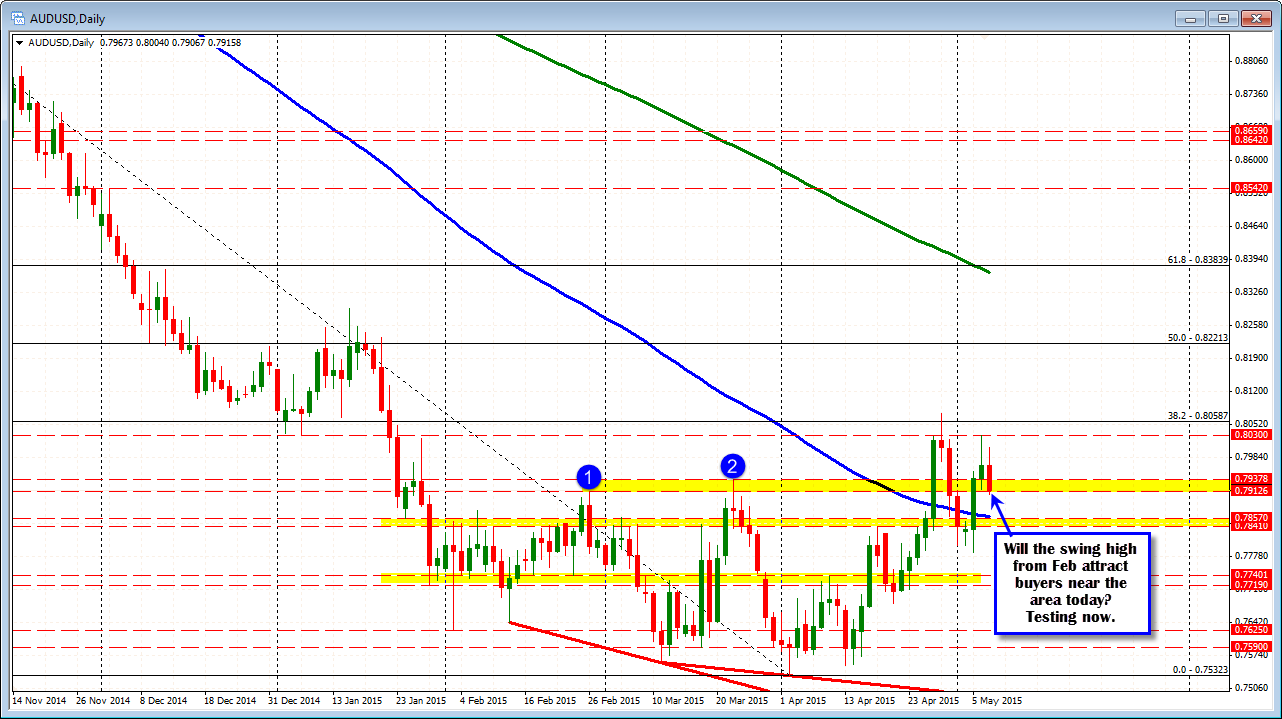
Looking at the daily chart, the 0.7912 level was the high from the month of February. The low has gone to 0.79067. With the hourly support,and a reason to find support on the daily, the level has an even greater significance, with a move below 0.7900 likely triggering stops from the dip buyers. If the bottom is to hold, needless to say a move above the 200 hour MA (at 0.7918) will be eyed. So far (looking at the hourly,) the pair is staying below that level. Are the sellers holding the line/ceiling? I guess it comes down to your bias. If you like the AUDUSD this is the place to buy. If you don't, this is the place to look for the confirmation break below this cluster of support.
A move lower will start to target the 100 day MA (blue line in the chart below, at 0.7861 currently)