
Is it time to move?
The AUDJPY is an interesting technical play.
Let's break it down...
Daily chart
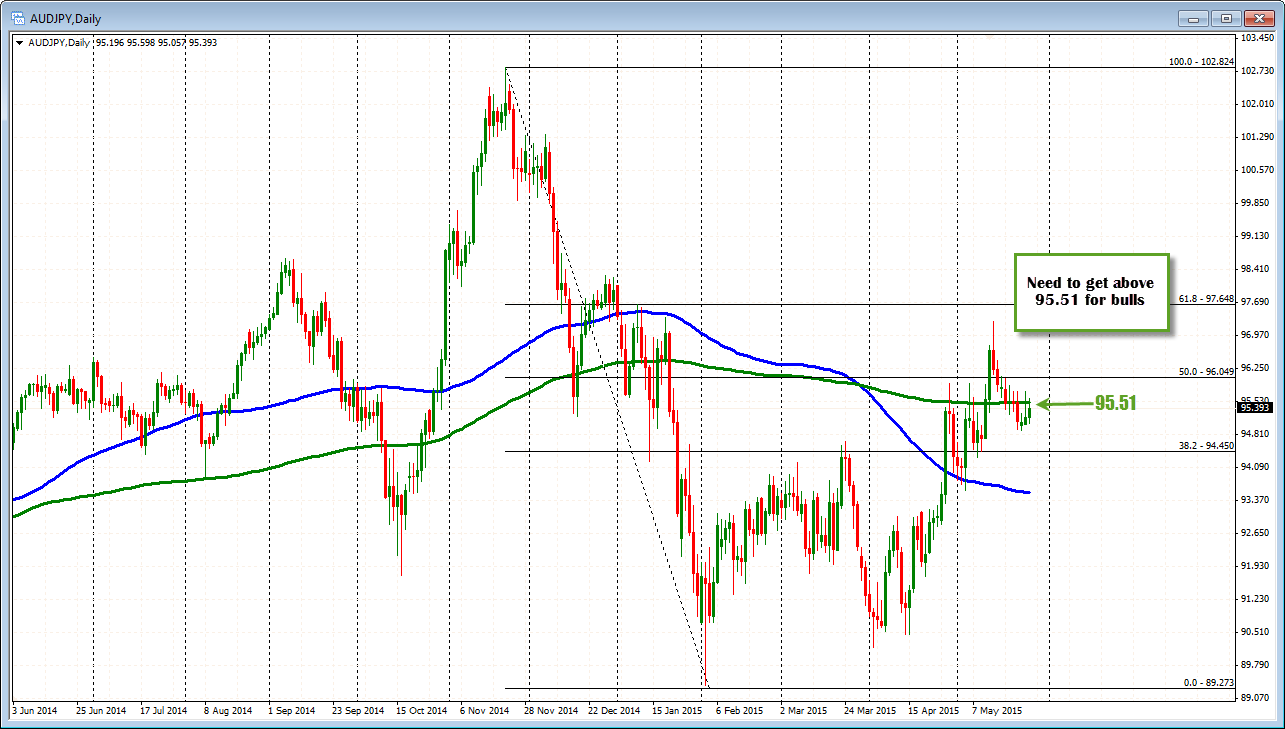
Looking at the daily chart, the pair moved below the 200 day MA last Friday and remained below over the first three days this week. The 200 day MA comes in at 95.51. The bears have the advantage below the 200 day MA. If the buyers are to take back control, a move above the 200 day MA will be needed.
Hourly chart
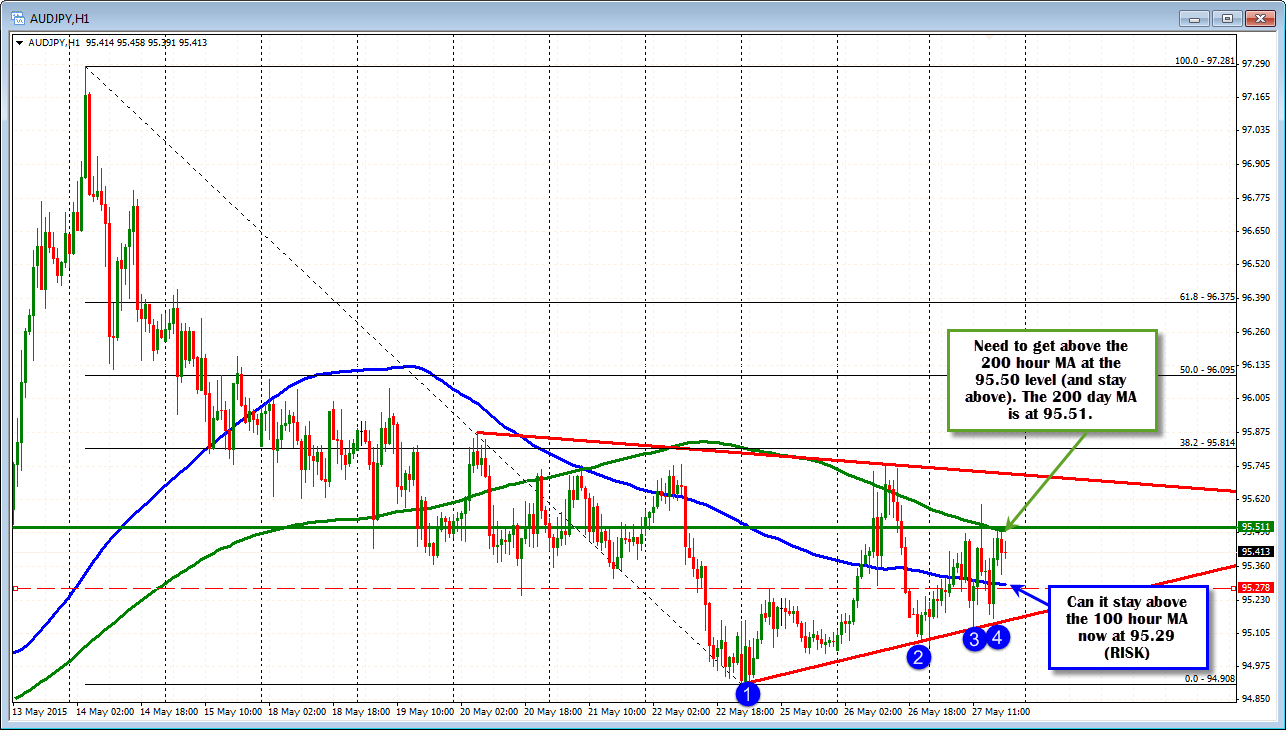
The price lows today based against a lower trend line. The price traded above and below the 100 hour MA. The 200 hour MA at 95.50 currently was breached once and quickly retraced.
If the price is to go higher, it needs to get and stay above the 95.50 level. This is also where the 200 day MA is at. On the downside, the 100 hour MA (blue line in the chart below), needs to hold support at the 95.29 level.
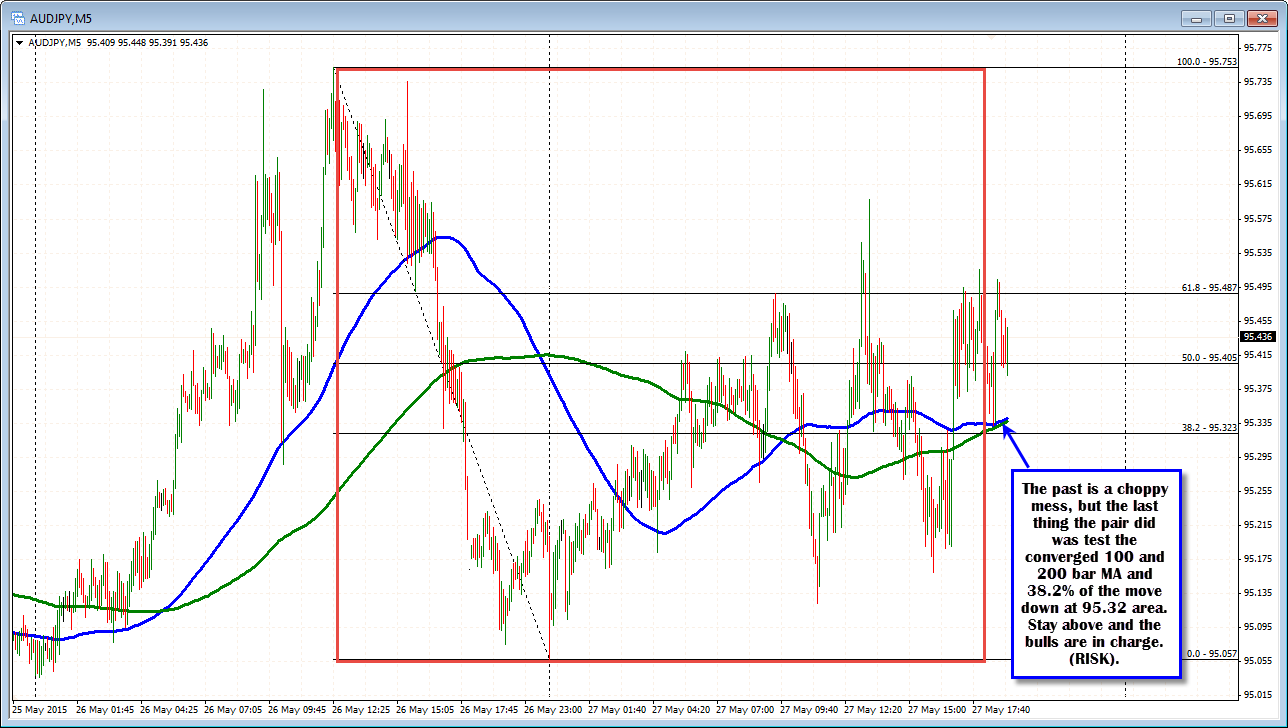
5-minute chart
Looking at the 5 minute intraday chart, the price action is garbage. Choppy up and down action. YUCK. However, the 100 and 200 bar MA was just tested (both MA are converged) along with the 38.2% retracement near the 95.32 area. This gives the pair a more bullish bias....now.
The USDJPY has been rising. The AUDUSD has been falling. Looking at the AUDJPY, the AUD has been under more pressure lately. Hence the decline of late. Right now, the pair can go either way. Move below the 95.29 level and the pair should continue to move lower. Move above the 95.51, and the price can go higher. Either way, the "lines in the sand" are drawn. Risk is defined. Look for the break and momentum seems to be the best option.

