
Finds 200 hour MA at the top and that was it
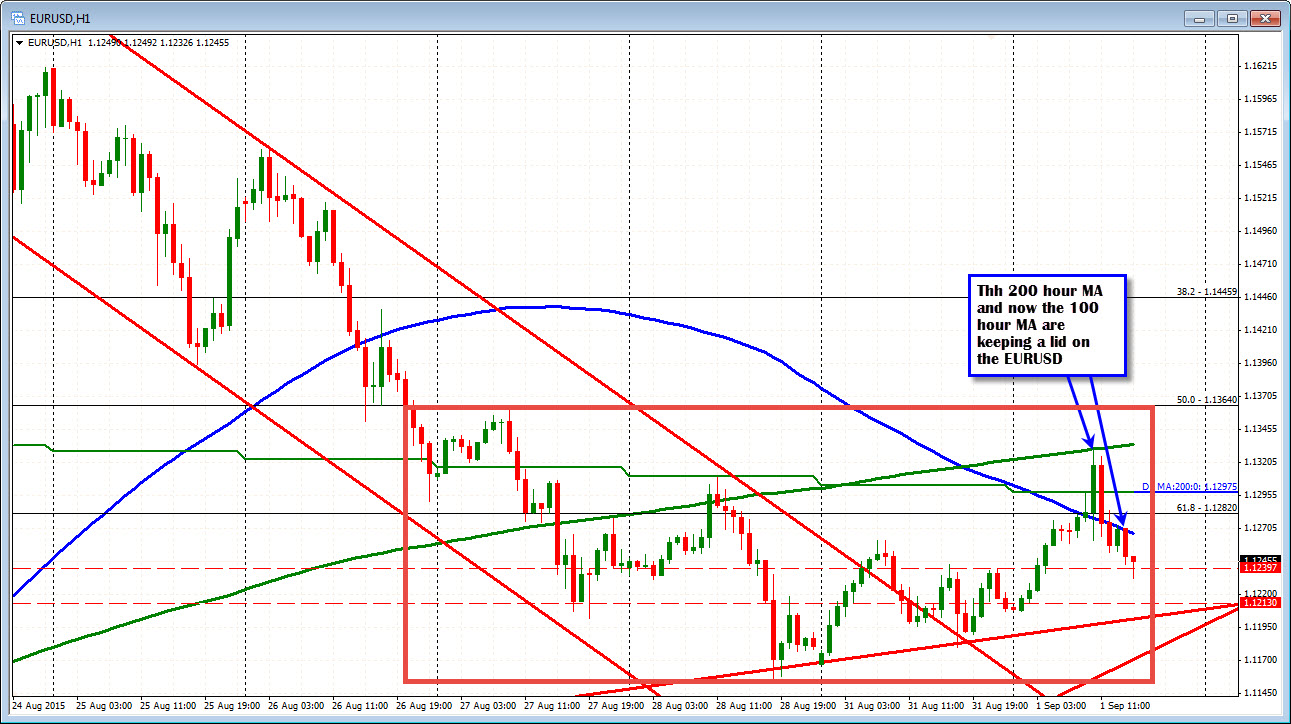
The EURUSD rose steadily in the Asia-Pacific in session and into the European morning. The rise was able to 1st test the 200 day moving average at the 1.12975 level. Then after breaking above that barrier, the next target became the 200 hour moving average at 1.1331. It was here that the price stalled and began its descent back to the downside.
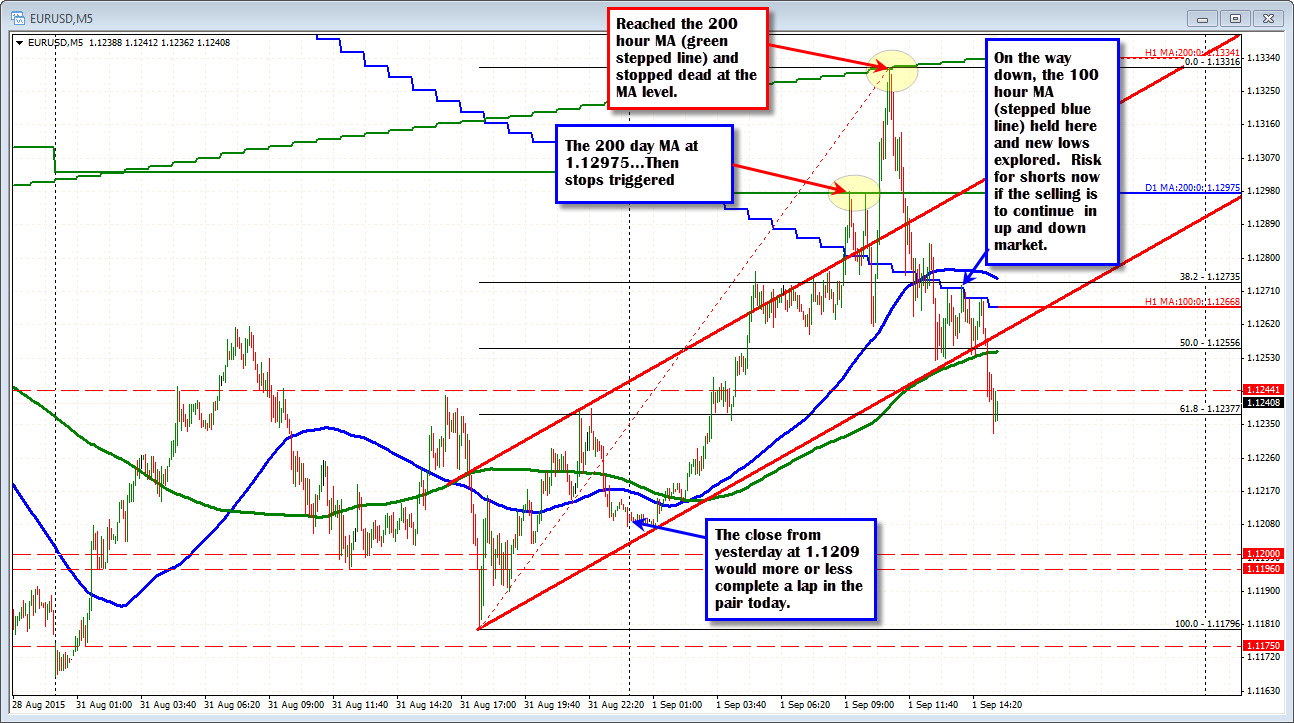
As North American traders ente,r they are facing a different technical picture. The price has moved back below the 100 hour MA (stepped blue line in the chart above) and now below both the 100 and 200 bar MA on the 5 minute chart (blue and green smoothed lines in the chart above). The 200 bar MA (green line at 1.1254 was just breached along with trend line support. That MA and trend line tried to hold but when the price could not extend above the 100 hour MA (stepped blue line), the market continued the probe to the downside. Traders will likely be using the 100 hour MA (at 1.12668) as risk now. There is not much support until the close from yesterday at 1.1209. We are back in the middle of the 3 or so day trading range (see chart below). The market is still suffering from liquidity/uncertainty woes. As Ryan said in his wrap, the market is wonky, got more wonky and even more wonky (or something like that)
The US session will see PMI data (Markit and ISM Manufacturing PMI) released at 9:45 and 10 AM respectively. Construction spending and IBD/TIPP economic optimism will also be released at 10 AM. The ISM manufacturing is expected to dip slightly in August to 52.5 from 52.7. The prices paid component is expected to fall sharply to 39.0 from 44.0. The employment component last month came in at 52.7. New orders rose to 56.5 in July. This was the highest since December 2014.

