
Moves above the 100 bar MA on intraday chart
The EURUSD has moved above the 100 bar MA on the 5- minute chart (blue line). That MA line has stalled the peaks in trading today - including one earlier in the NY session. The correction off that high could not take out the low - nor support at the 1.0517-26 area (see prior post outlining that key support area).
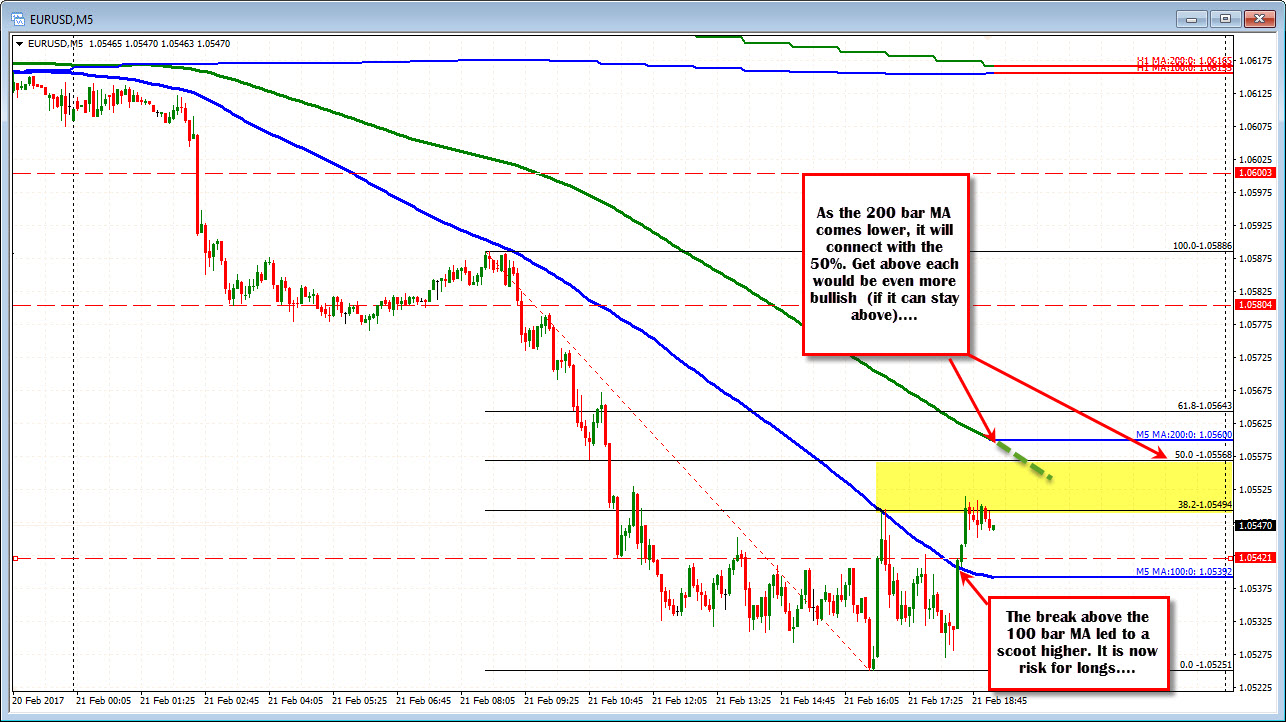
The move above the 100 bar MA is a little bullish. There are other hurdles that need to be breached, but it is a start.
What would be more bullish?
Get above the 200 bar MA (green line) and the 50% of the last trend leg down (at 1.0549-56 area). If those levels can be breached (and stay that way, the sellers from above, may start to feel a bit more uneasy. Remember, a pretty good support level held at the lows. (see prior post on the EURUSD)
For now the buyers on the break of the 100 bar MA may be on a little 5-minute chart, but the buyers on that break are not feeling any pain. The question that needs to be asked now is "Do the sellers from above feel any pain or have any fear?" If they do, they may look to take profit and that may encourage a larger rotation higher.

