..but can it stay above?
The EURGBP has been toying with a break over the 200 day MA today and over the last few weeks.
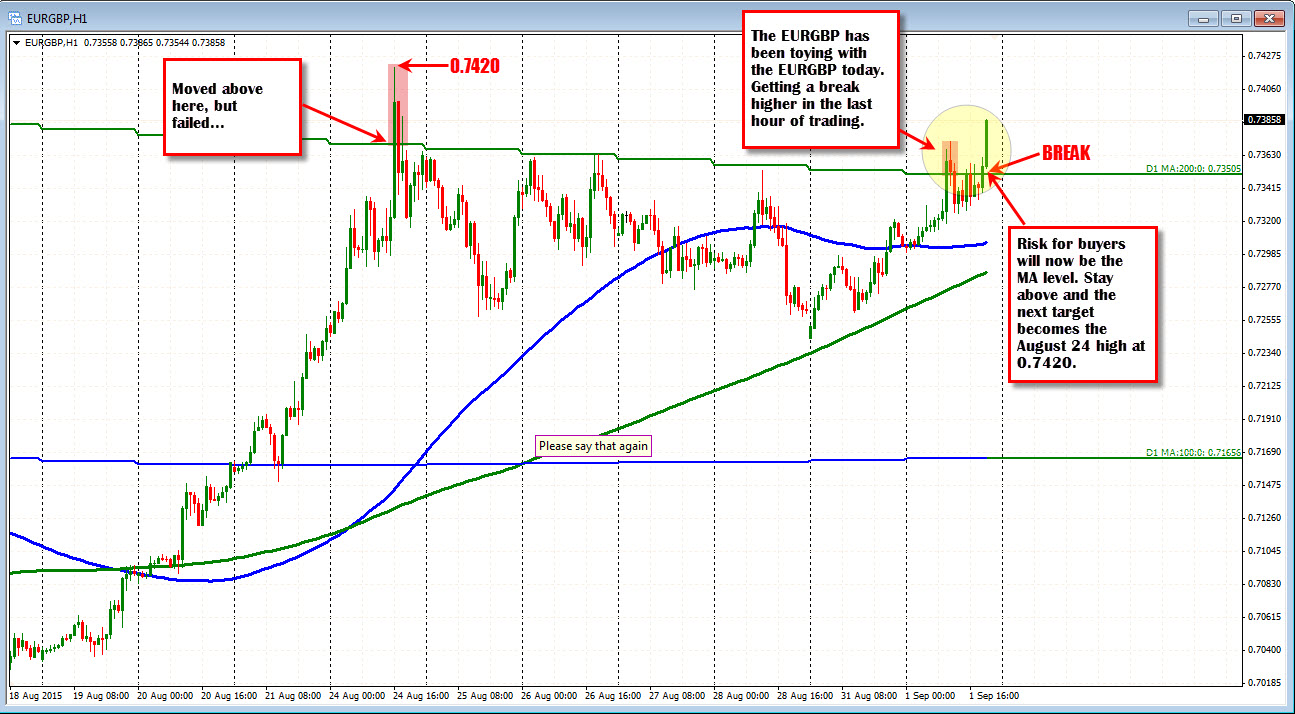
Back on August 24, the pair moved above the key MA (stock plunge day) but came back down (see the line marked D1 MA:200.0 in the chart above). The pair then tested but held below the MA on August 26th and 28th. Today with the stock market falling sharply again (I guess that is the catalyst?), the pair is shooting higher again and seeing what life is like above that key MA. Risk for longs will be the break level at 0.7350. The next target is the high from August at 0.7420.
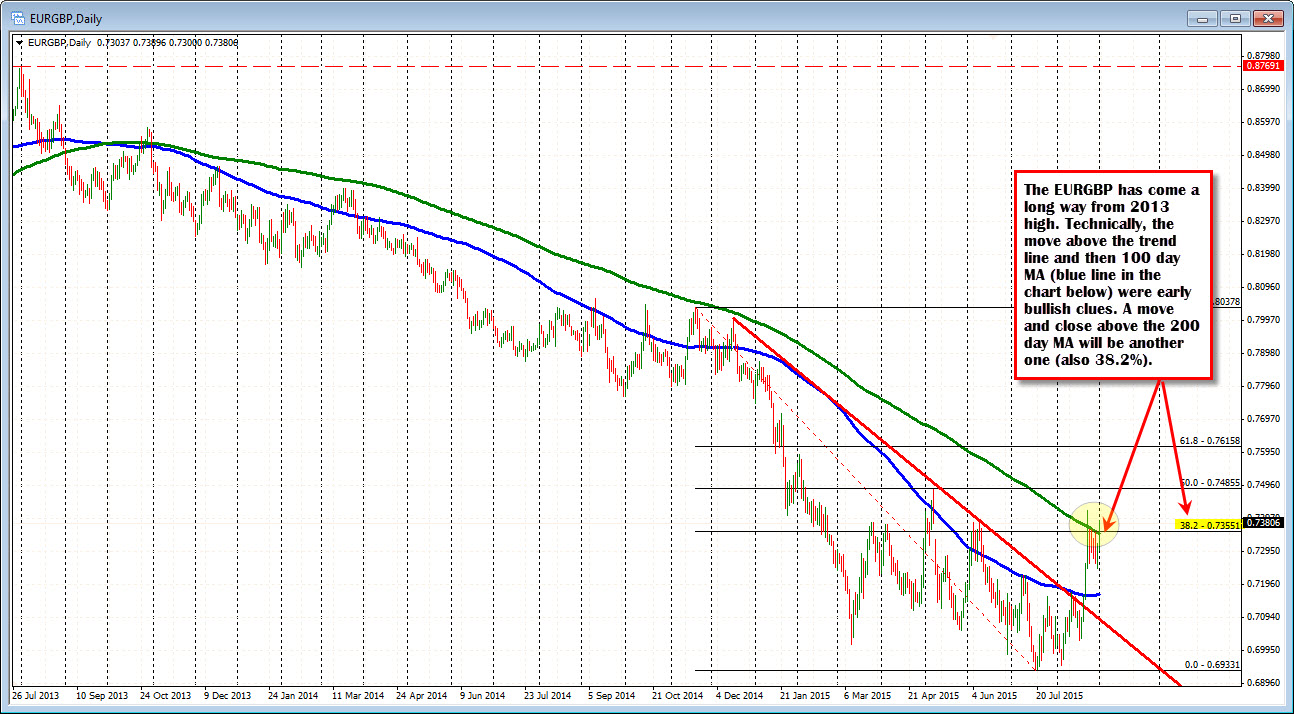
Looking at the daily chart, the pair has been trending lower since June 2013 at 0.8769. The low was reached in July at 0.69331 (21% decline). The pair has been able to extend above downward trend line and 100 day MA (blue line in the chart below). A move and close above the 200 day MA (and 38.2% of the move down from the November high at 0.7355) will be another bullish milestone which should solicit more buying momentum. Note the 50% retracement on the daily chart is near the April corrective high at 0.74855. Key target should the bullish momentum continue. .
Fundamentally, the expectations are that the BOE will tighten before the EU which should keep a lid on the EURGBP rise. However, the timing of a BOE tightening has been delayed and perhaps too much was priced in (21% decline). This might give the UK economy some temporary currency relief from it's European neighbors. What we do know is risk can be defined and limited against the 200 day MA/38.2% retracement.