
Yellen/Fed member comments keep doors open for March
Yellen kept the door open for a March hike with her testimony this week. Other Fed officials have also been more hawkish (sans Bulllard who once again might have gotten himself stuck in the corner with his non conforming dovish view).
Yields on treasuries have moved higher this week with the 10 year up from 2.41% earlier this week to 2.51% today.
Having said that although the dollar moved higher today initially, we have seen a nasty corrective move lower in the greenback. That correction has settled down a bit.
Let's say the Fed does embark on a series of more regular tightenings? Will/should the dollar more higher? It should. I would assume more regular will come because the Fed is concerned about inflation. What would cause that?
- Tighter labor. Although wages have not gone up given the employment gains, the risk remains
- Stronger growth from fiscal measures. Tax policy. Fiscal spending. Does Pres. Trump care about the risks of spending too much, lowering tax rates too much, or budgets? A promise is a promise. No risk it. No biscuit.
- Import inflation. What does a border adjustment tax do to prices domestically
- Surging asset prices. If business is coming back domestically and there are more jobs, that should be good for stock market and capital flows into other assets in the US.
Now Trump wants his cake and eat it too. He would prefer to have a lower dollar, but if the dollar goes higher, at least he could always blame everyone else for manipulating their currency (even though it would be US derived).
Having the dollar go higher and it going higher are two different things. We could wish all we want but things never really go perfectly. So I watch the charts and the tools. Will have the eye on the news. If things go as planned, it will be reflected in both.
IF the dollar is to go higher, what has to happen for some of the major pairs.
Well here goes....
EURUSD.
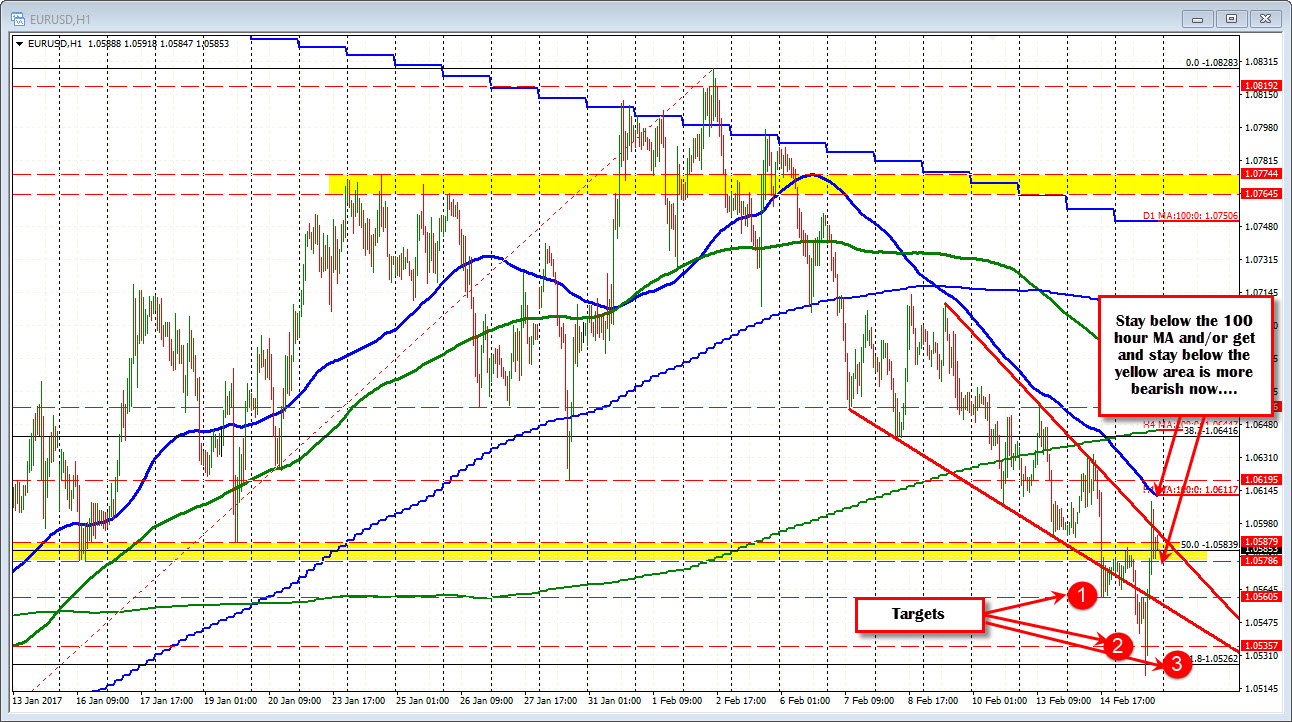
The EURUSD since Jan 12, has moved up and back down (with lots of mini ups and downs in between). The high reach on Feb 1 was able to extend above the 100 day MA. That was a significant break at the time as it represented the 1st time the pair closed above the key MA since early October 2016. The problem is that break only lasted for 9-hours. The price moved back below and that was the last close above that MA level.
Yesterday and into today, the pair fell back below the 50% of the move up from the Jan 3rd lows. That is the midpoint of the year. That level comes in at 1.05839. However after reaching the 61.8% at 1.0526 (and trading below it briefly), the short squeeze was on and the price moved back above the 50% level at 1.0583. That led to a squeeze toward the 100 hour MA at 1.0611 (blue line).
What would be more bearish (dollar bullish).
- Get below 105786-87 area and stay below. Targets are 1.0560, 1.0535 and the 61.8% at 1.0526 (61.8%).
- If the price cannot get below that support and the price squeezes higher, if the price stays below the 100 hour MA at 1.0611 currently, that keeps the sellers in control.
USDJPY
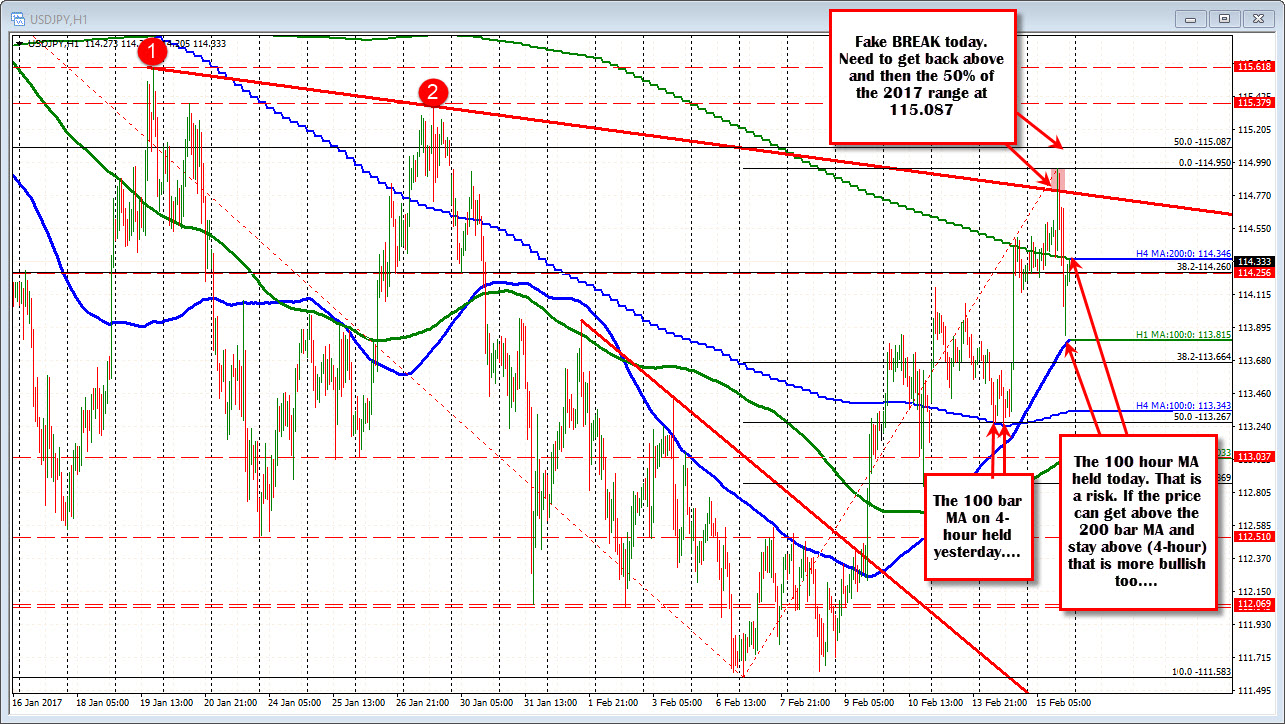
The USDJPY based at the 100 bar MA on the 4-hour chart yesterday (at 113.34 currently - see blue step line), and moved above the 38.2% of the move down from the Jan 4 high (at 114.264). The 200 bar on the 4-hour chart stalled the rally yesterday.
Today, that MA was broken and the price moved up above a topside trend line but stalled ahead of the 50% of the 2017 trading range at 115.087. The tumble lower moved back below the 200 bar MA on the 4-hour chart , the 38.2% and tested the rising 100 hour MA at 113.815.
What would be more bullish (dollar bullish) now?
- We need to get and stay above the 200 bar MA on the 4-hour chart and then the topside trend line at 114.78 and the 50% at 115.087.
- If the price cannot get above those levels, the 100 hour MA below (at 113.815 currently) will be the line to stay above.
GBPUSD
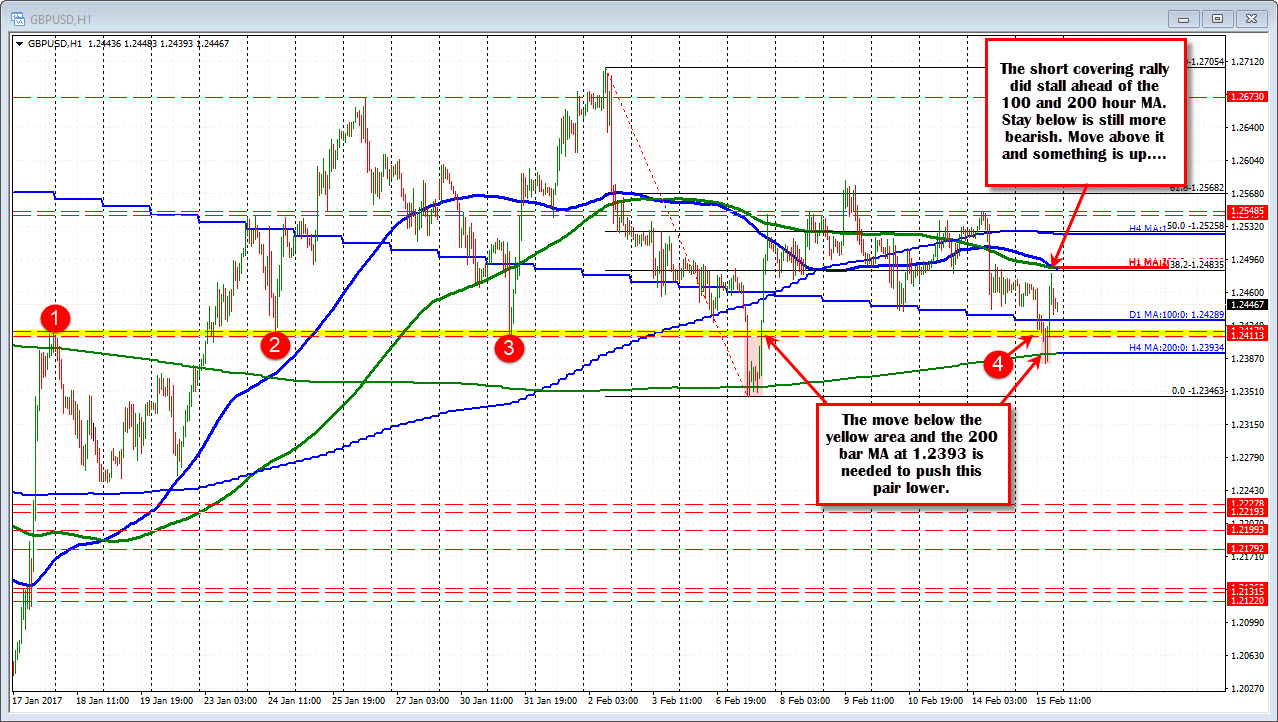
The GBPUSD ran lower today but stalled after breaking below the 200 bar MA on the 4-hour chart at 1.2394. That was the 2nd look below that MA line since Jan 20th and the 2nd look that failed without much momentum.
Today the price also move below the 1.2411-17 which was a swing high and swing lows going back to Jan 17/18.
What would be more bearish for the GPUSD (dollar bullish) now?
- Move back below the 100 day MA at 1.2428, the 1.2411-17 area and then the 200 bar MA on the 4-hour chart at 1.23934.
- If the price cannot do that and moves back higher, a bearish bias would remain if the price can stay below the converged 100 and 200 hour MAs at 1.2484. A move above those MA's line and dollar higher is not really playing out as planned.

