
If the nut won't crack maybe it's no good
0.7269 is the level I highlighted some time ago as a target for shorts. We've had another look, broken through to 0.7255, but have moved back above
The move under 0.7269 may have loosened up the screw a bit more but until we get a break and hold then the risk is still there for a bottom to be put in place and a bounce to follow
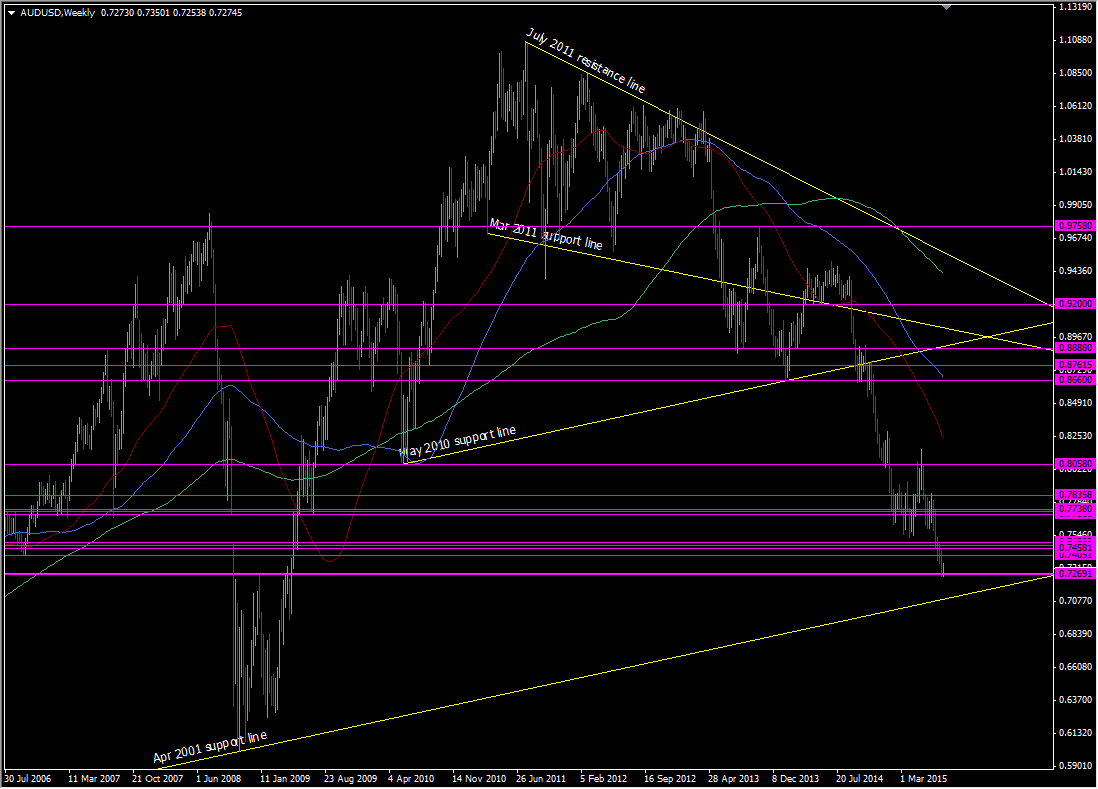
AUDUSD weekly chart
On the lower time frames we can see the bearish pressure the aussie is under but we're at a point where we need to ask a question. Can we break lower or do we move higher?
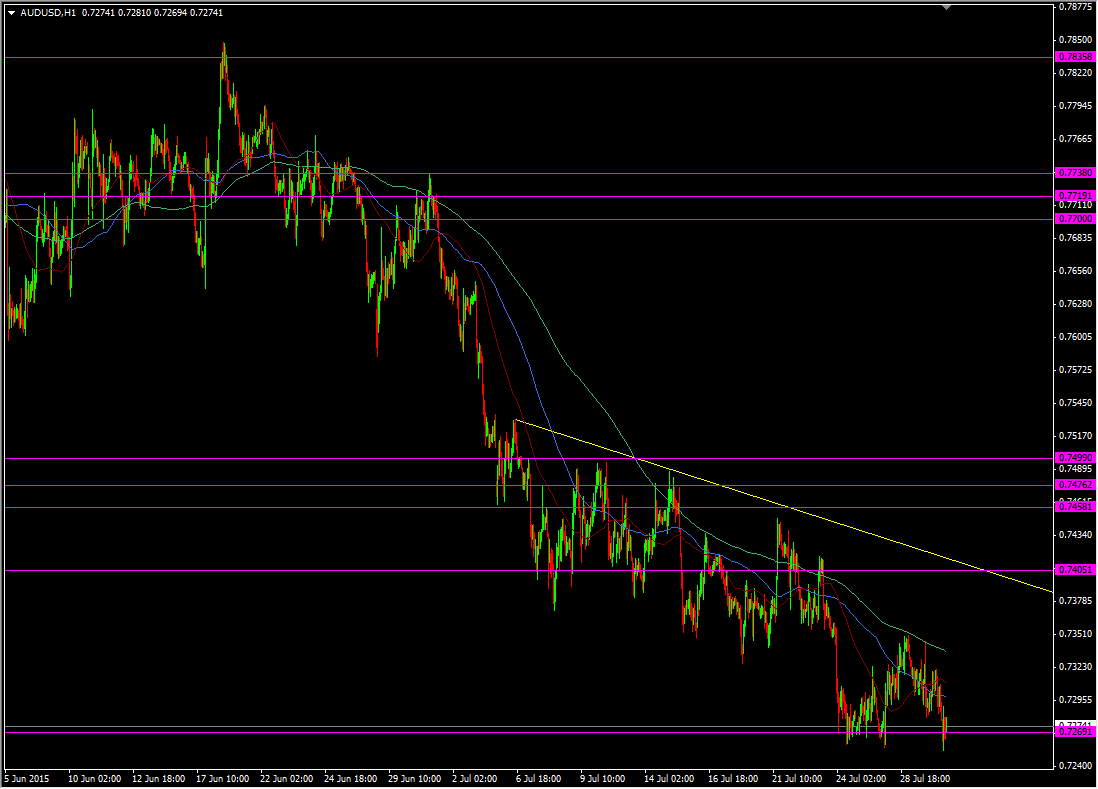
AUDUSD H1 chart
Trading is all about questioning what is happening, questioning the price action. It's a 50/50 chance whether we go up or we go down
The bearish tone gives me confidence that we do break this level properly. If we do, and confirm it, then I'm going to look to add to shorts for my next target against the Apr 2011 support line. If we don't break here then that's the clue to take more of the trade off the table and wait to see what the prices does when it moves back up.
0.7350 is one area where a break will increase the chance of a higher push. Breaking out from that July trend line will be a warning sign that the downside is over for now
The cards are still stacked in favour of a bearish bias so we should still feel comfortable selling decent rallies

