Did I say risk is high...
The stocks are opening higher with the Nasdaq, S&P and Dow up on the day. The bond yields are steady. Gold is little changed too.
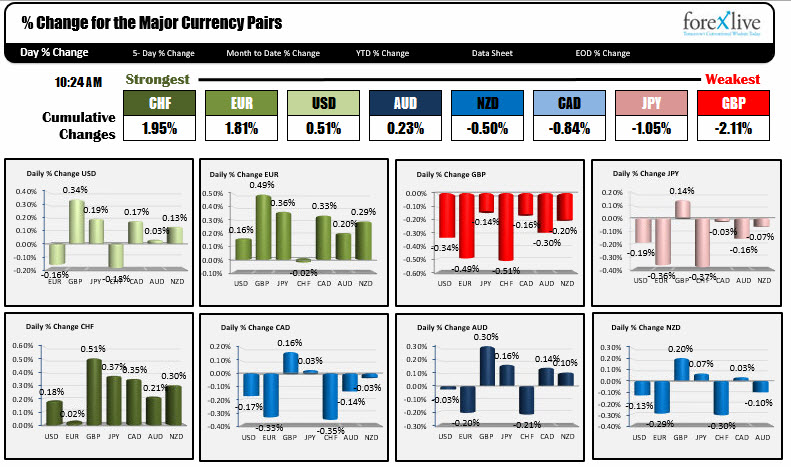
The dollar is mixed with gains against the GBP, JPY, CAD, AUD and NZD and losses against the EUR (better data) and CHF. The strongest currency is the EUR. The weakest is the GBP.
Today, there should be a vote (or so the President says) on the healthcare bill. When that happens, no one knows really knows but the estimate is sometime near the close of stocks. Meanwhile, if it fails, Trump says it is on to tax reform. That should be more positive/easier for Trump. Perhaps that was the plan all along. Healthcare is an albatross around everyone's necks. Maybe the President wants to get drug prices down first. Start there and then go into the quagmire of all the other stuff under the umbrella called healthcare reform.
For traders, I still think there is great risk. That does not mean we will necessarily do anything. The price action today is fairly controlled so far and the stocks are opening higher. So what is the big deal?
Nevertheless, it may be that there may be some concern over the weekend and that may lead to some position squaring before then. The speculative positions are more long dollars according to the recent CBOT data, but we have seen moves lower of late. So some of those dollar longs may have already covered.
Anyway, whether you trade or not today, here are the technicals for some of the majors for today and into next week.
EURUSD:
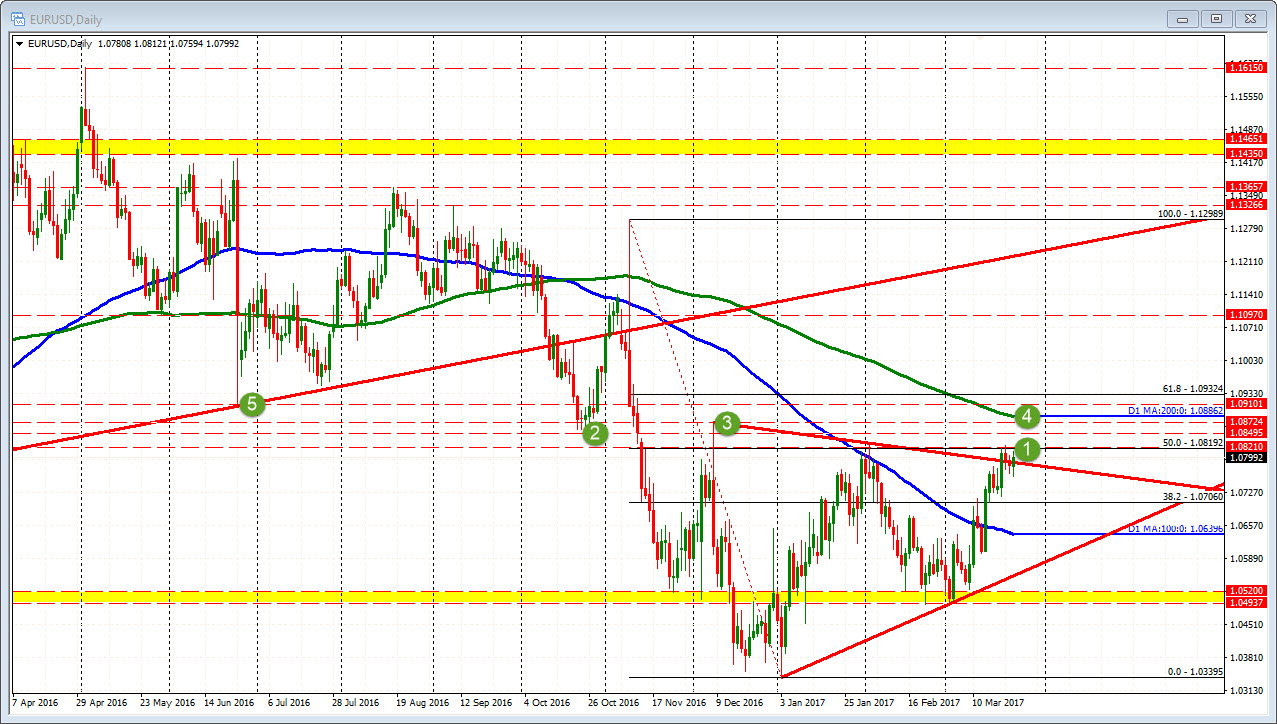
Yes....The 1.0819-28 remains a topside level to get to and through. That story has remained the same for the whole week. For those who missed that lesson the 1.0819 level is the 50% of the move down from the November election high (see chart above). The 1.0828 level was the high back on Feb 2nd when the price broken above that 50% level and failed.
This week, the price made it above the 1.0819 level again, but could only get to 1.0824. Not much of a break.
IF, the pair gets above that level, their remains other resistance mines at 1.0849, 1.0872 and the 200 day MA at 1.0886, and 1.0910 (see green circles outlining the levels on the daily chart above). It opens up above that level.
On the downside, looking at the hourly chart below, the 100 hour MA at 1.07833 will be eyed first. That MA was a floor for most of trading yesterday. Today, the price fell below and then move back above on the EU data today.
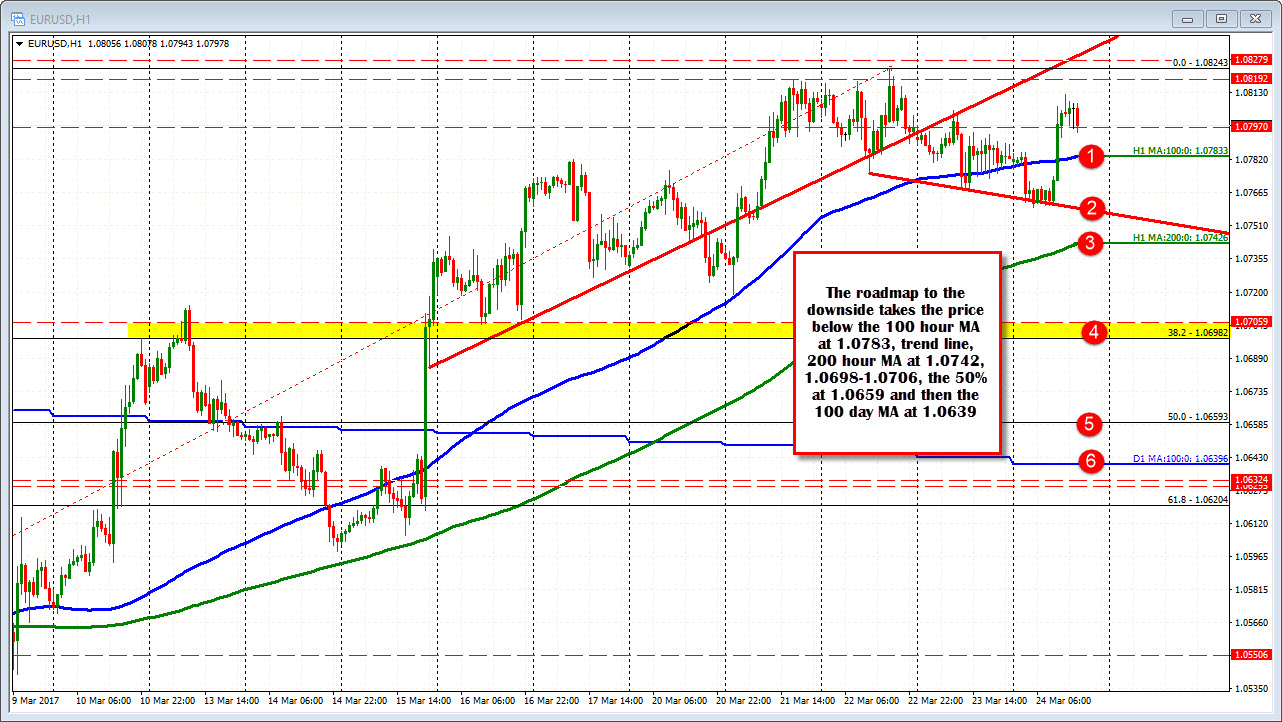
After that , trend line support comes in at 1.0758 (see hourly chart below) and then the rising 200 hour MA at 1.0742.
If the MA is broken (it has not been below since March 9th), the 1.0698-1.0706 is a key area. The 1.0698 is the 38.2% of the move up from the March 2 low.
The 1.0706 is the lows from March 16 AND the old 38.2% of the move down from the Election day high. That is a key level. Move below that level and there should be more selling in the pair with 1.0660 (50% of the move up from March 2) and the 100 day MA at 1.0635 the next KEY targets.
USDJPY
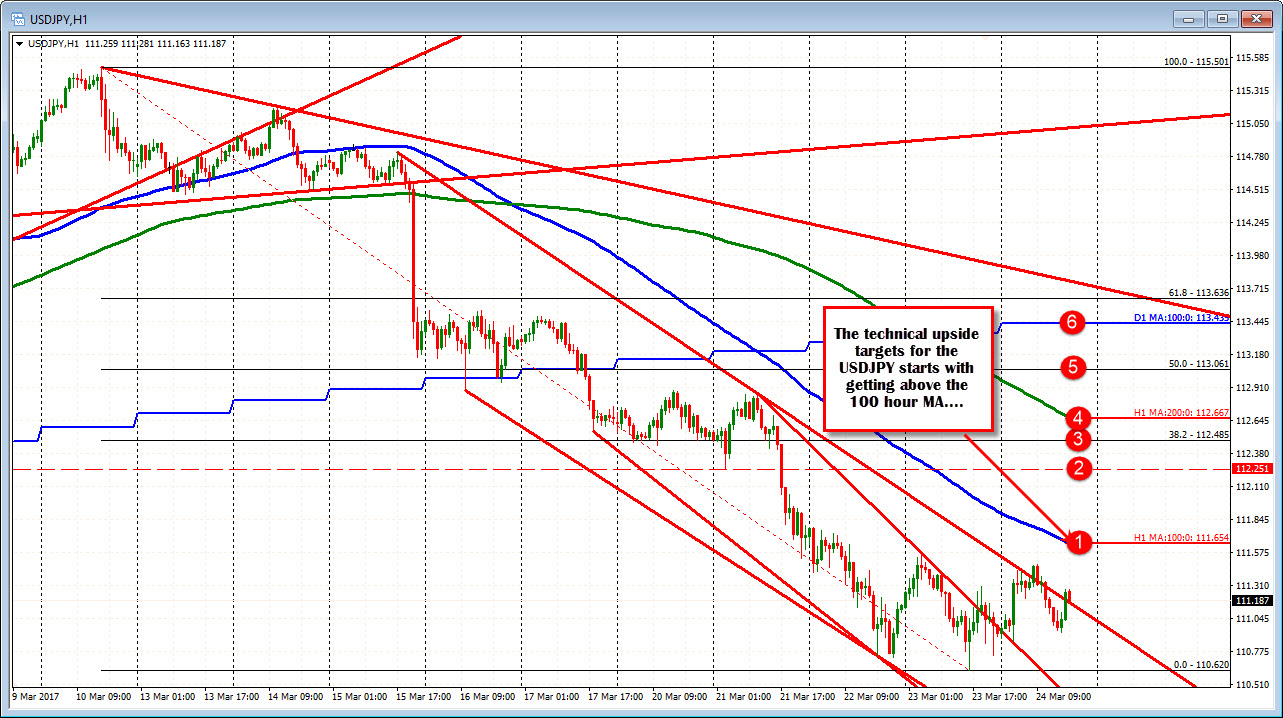
The USDJPY has been down 8 days in a row and 9 of the last 10. Yesterday the price closed at 110.92. The price is higher today - trading at 111.24.
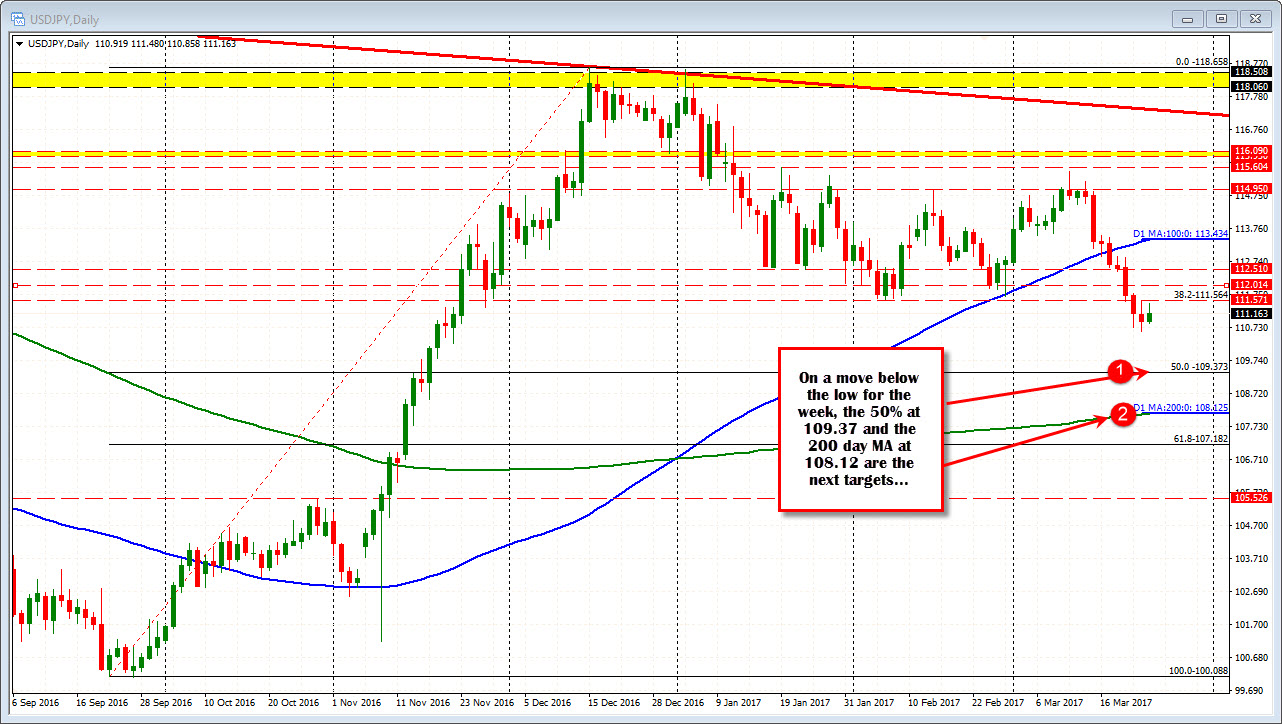
Looking at the daily chart, the move up from the September 22 low has the 111.564 as the 38.2% retracement. That was near the 111.58-62 lows from Early February. The low on Feb 28th bottomed at 111.68. Getting back above those levels are the first upside targets for the pair.
Looking at the hourly chart below, the 100 hour MA comes in at 111.654. The price has not moved above the 100 hour MA since March 14th. Above that and the 112.25 was the swing low from early March 21. The 38.2% of the trend move lower from the March 10th high comes in at 112.485 and the 200 hour MA comes in at 112.667.
IF the price extends above that MA line, the 113.06 is the 50% and then the 100 day MA at 113.44.
If the USDJPY gets hit,t eh low for the week at 110.62 was somewhat random, but a break will have the pair looking toward the 50% of the move up from the Sept 22nd low at the 109.37 level. Below that is the 200 day MA at 108.125.
GBPUSD
The GBPUSD is trading near the lower levels for the day after doing most of the downside stuff in the Asian session after a trend line was busted.
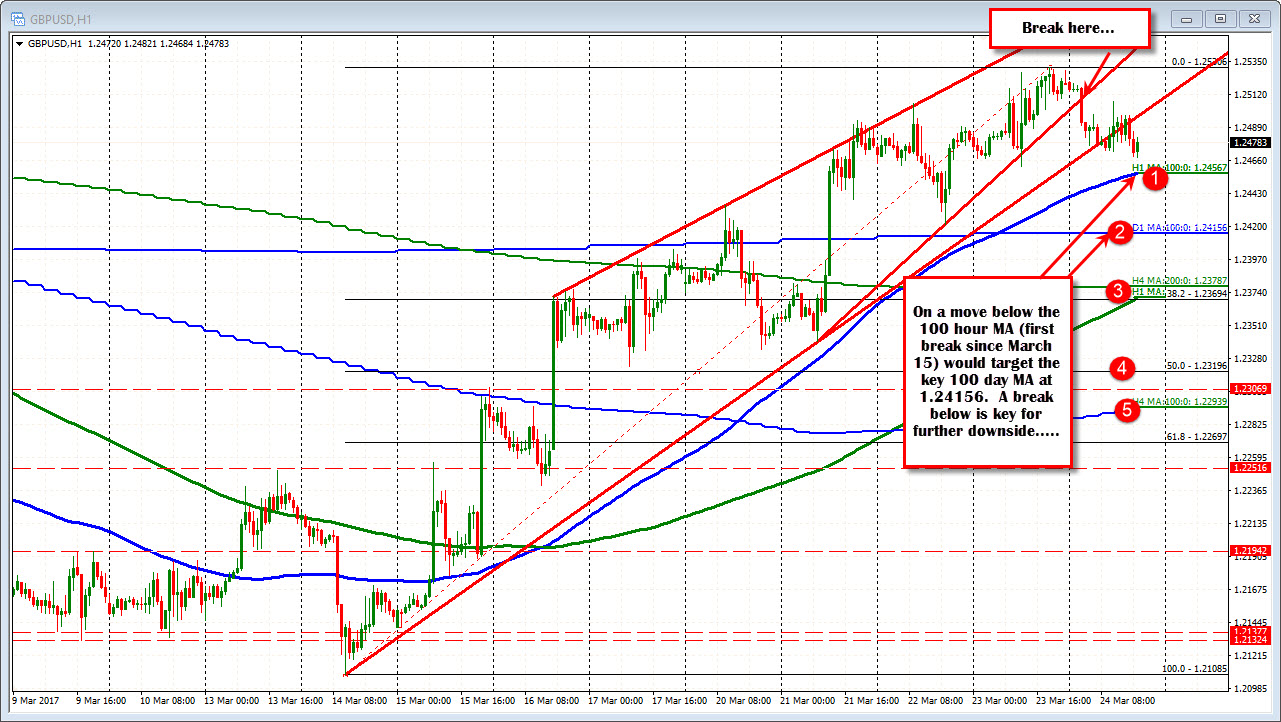
The price has been moving up and down in choppy trading. The sideways has allowed the 100 hour MA to catch up to the price at 1.2456 level. A move below that MA and we should see a move down toward the 100 day MA at 1.24156. On a move below that level and the pair will look toward a cluster of support defined by the 200 hour MA, the 38.2% retracement and the 200 bar MA on the 4-hour chart at the 1.2369-78 area.
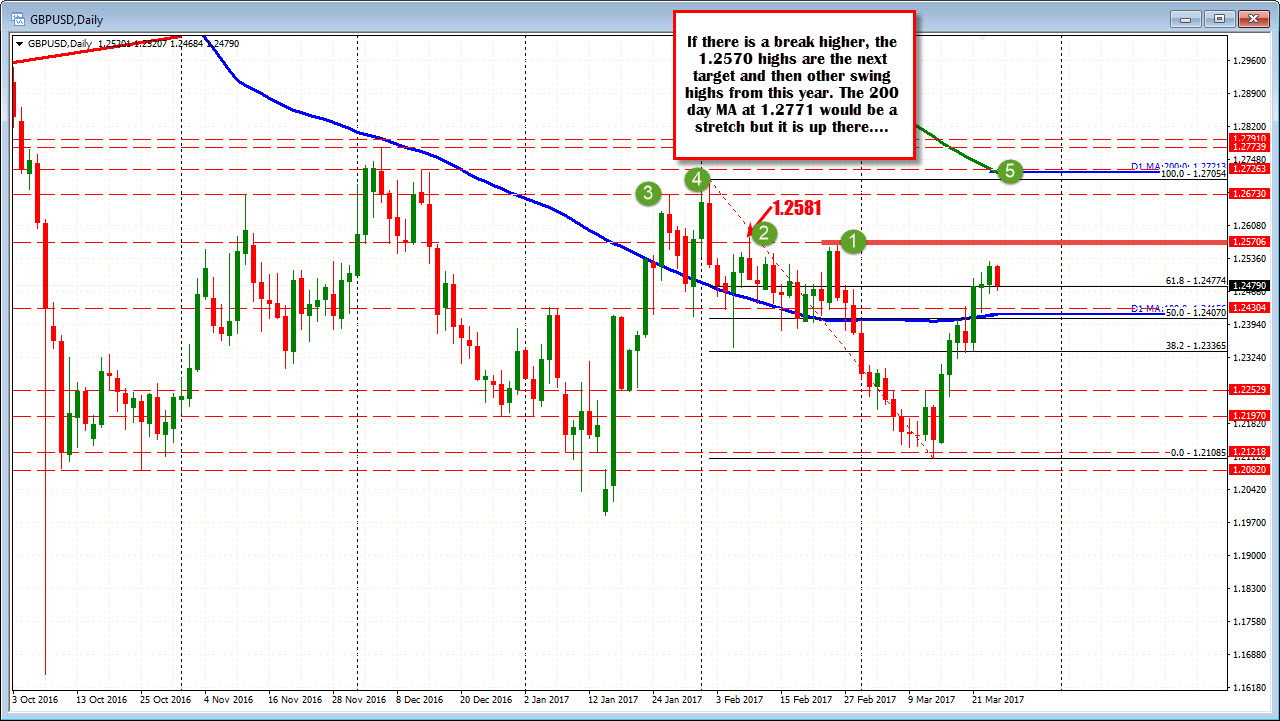
On a further squeeze higher, the 1.2570 is the next upside target followed by other swing highs. The 200 day MA is a stretch but if there is a squeeze, the GBPUSD has shorts to squeeze in it.
I have some personal things to take care of for the rest of the day.So wishing you all a great weekend. Risk is higher than usual so trade accordingly.


