
December 27th, 2016
EURUSD:
The pair remains contained on the hourly chart by the 200 hour MA at 1.04500 above and the 100 hour MA below at 1.04282.
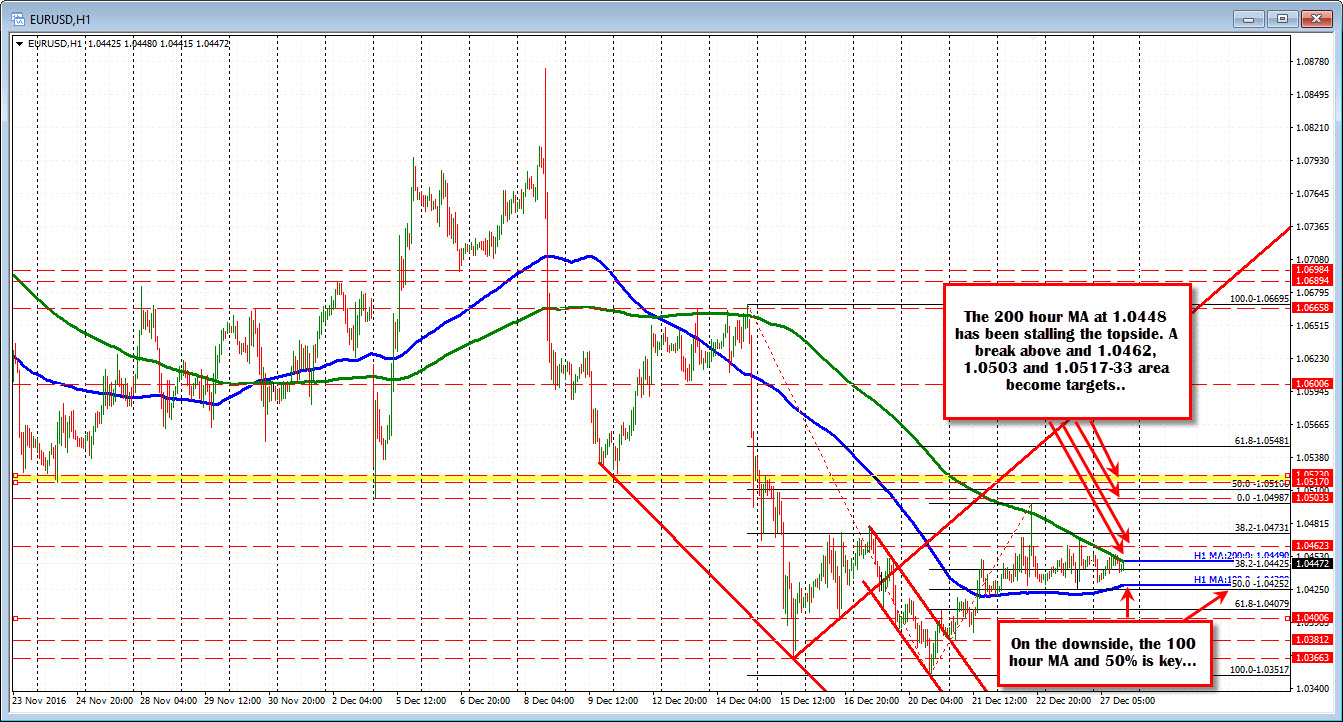
ON the topside, the 1.0462 was the old 2015 low price. Above that the 38.2% and 1.0473 and the 1.0518-21 becomes the next upside target to get to and through.
ON the downside, a move below the 100 hour MA at 1.0428 and the 1.0425 level (50% and low from Friday and the 61.8% of the move up from Dec 20 at 1.04079 and swing lows from December at 1.04000, 1.0381 and 1.0366 and 1.03517 become the targets for the pair.
The pair is confined within the MA bookends and until there is a break, traders will lean and try to pick up a few pips here and there.
USDJPY:
The hourly chart of the USDJPY has been moving a little above the 200 hour MA and a little below the 200 hour MA since Friday. The 200 hour MA comes in at 117.43. Just above is the 100 hour MA at 117.53. A topside trend line cuts across not far from there at 117.60.
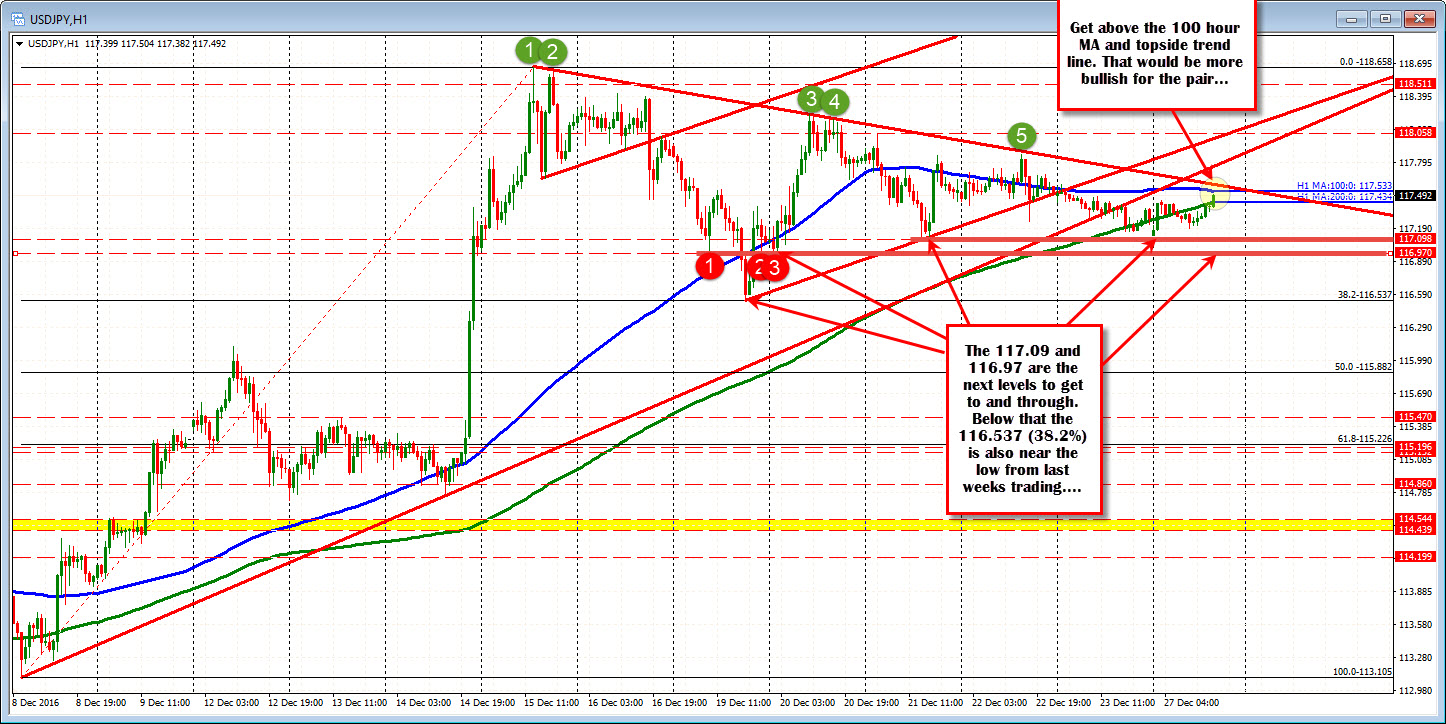
Those 3 levels represent what needs to be broken (and stay broken) to help the bullish technical picture. We just peaked above the 200 hour MA after the S&P data but we are not exactly racing but buyers are trying.
On the downside, the low from Wednesday (last week) at 117.09 and then a number of swing lows from Dec 19 and 20 at 116.97 become the next hurdles to get through for a more bearish picture. After that, and the 38.2% of the move up from Dec 8th at 116.53 was also lowest low from last weeks trading.

